3 Methods to Save Plots as Images or PDF Files in Matplotlib
Table of Contents
- Introduction
- Method 1: Using savefig()
- Method 2: Using imsave()
- Method 3: Using PIL (Python Imaging Library)
Introduction
Matplotlib is a powerful plotting library in Python that offers a variety of visualization options. Sometimes, you may want to save your plots as image files instead of displaying them. This can be useful for sharing, including in presentations or reports, or for further processing. In this article, we will discuss three methods to save plots as image files in Matplotlib: using savefig(), using imsave(), and using PIL (Python Imaging Library).

Method 1: Using savefig()
The usual way to save a plot as an image file in Matplotlib is by using the savefig() function. This function saves the current figure to a file with the specified format (such as PNG, JPEG, or PDF).
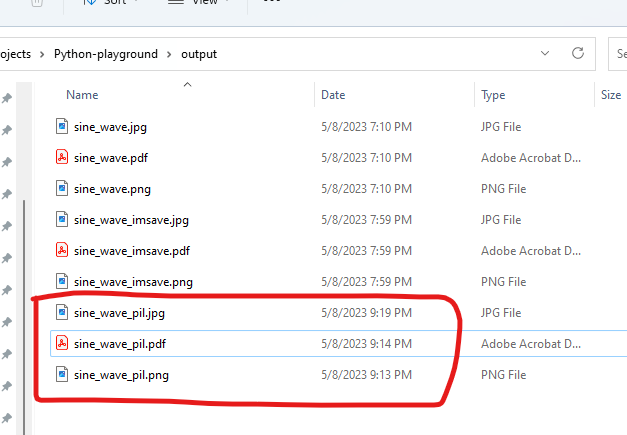
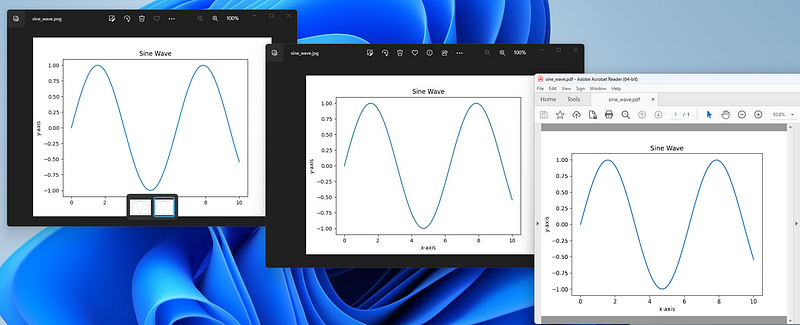
Here’s an example, we can save the PNG, JPEG, and PDF files to the output folder.
import matplotlib.pyplot as plt
import numpy as np

# Generate sample data
x = np.linspace(0, 10, 100)
y = np.sin(x)
# Plot the data
plt.plot(x, y)
# Set the title and labels
plt.title("Sine Wave")
plt.xlabel("x-axis")
plt.ylabel("y-axis")
# Save the plot as a PNG, JPEG and PDF files
plt.savefig("output/sine_wave.png")
plt.savefig("output/sine_wave.jpg")
plt.savefig("output/sine_wave.pdf")
We can find the tree files have been created under the output folder.

Method 2: Using imsave()
The second method is using the imsave() function from the matplotlib.pyplot module. This function saves an array as an image file, and it’s helpful when you’re working with image data or customizing the output.
Here’s an example:
import matplotlib.pyplot as plt
import numpy as np

# Generate sample data
x = np.linspace(0, 10, 100)
y = np.sin(x)
# Create the figure and axis objects
fig, ax = plt.subplots()
# Plot the data
ax.plot(x, y)
# Set the title and labels
ax.set_title("Sine Wave")
ax.set_xlabel("x-axis")
ax.set_ylabel("y-axis")
# Save the plot as a PNG image file
plt.savefig("sine_wave.png")
# Convert the figure to a NumPy array
fig.canvas.draw()
image_array = np.array(fig.canvas.renderer.buffer_rgba())
# Save the NumPy array as a PNG, JPEG image file and PDF file using imsave()
plt.imsave("output/sine_wave_imsave.png", image_array)
plt.imsave("output/sine_wave_imsave.jpg", image_array)
We can find the tree files have been created under the output folder.


Method 3: Using PIL (Python Imaging Library)
The third method to save a plot as an image file is by using the Python Imaging Library (PIL), which has been forked as Pillow. This library provides additional image processing capabilities and can be used to save Matplotlib plots as image files.
Firstly, we need to install the Pillow library.
pip install Pillow
Here’s the code example to save PNG and PDF files.
import matplotlib.pyplot as plt
import numpy as np
from PIL import Image

# Generate sample data
x = np.linspace(0, 10, 100)
y = np.sin(x)
# Create the figure and axis objects
fig, ax = plt.subplots()
# Plot the data
ax.plot(x, y)
# Set the title and labels
ax.set_title("Sine Wave")
ax.set_xlabel("x-axis")
ax.set_ylabel("y-axis")
# Convert the figure to a NumPy array
fig.canvas.draw()
image_array = np.array(fig.canvas.renderer.buffer_rgba())
# Convert the NumPy array to a PIL Image
image = Image.fromarray(image_array)
# Save the PIL Image as a PNG image file and PDF file
image.save("output/sine_wave_pil.png")
image.save("output/sine_wave_pil.pdf")
The JPEG format doesn’t support the alpha channel (transparency) present in the RGBA mode. So we can convert the image to RGB mode before saving it as a JPEG file.
The following is the code example to save the JPG file.
import matplotlib.pyplot as plt
import numpy as np
from PIL import Image

# Generate sample data
x = np.linspace(0, 10, 100)
y = np.sin(x)
# Create the figure and axis objects
fig, ax = plt.subplots()
# Plot the data
ax.plot(x, y)
# Set the title and labels
ax.set_title("Sine Wave")
ax.set_xlabel("x-axis")
ax.set_ylabel("y-axis")
# Convert the figure to a NumPy array
fig.canvas.draw()
image_array = np.array(fig.canvas.renderer.buffer_rgba())
# Convert the NumPy array to a PIL Image
image = Image.fromarray(image_array)
# Convert the image to RGB mode
image_rgb = image.convert("RGB")
# Save the RGB image as a JPEG image file
image_rgb.save("output/sine_wave_pil.jpg", format='JPEG')