

Automated Trading Bot with MetaTrader5 and Python
How to calculate a 200-Day SMA with Python 3 and MetaTrader 5
There are a ton of signals to analyze when using quantitative analysis for stock/crypto/futures/FOREX trading!
About This Series
This series demonstrates the automated analysis of 8 different market signals.
Using Python 3, Python Pandas, and MetaTrader5, I’ll show you how to calculate 8 common signals. If you’ve been following my previous series “How to Build a MetaTrader 5 Python Trading Bot”, you’ll be able to immediately integrate these into your python Trading Bot.
All code for this tutorial can be found on my GitHub, and I’ve included working code samples throughout (use at your own risk, give me a shout-out if you do).
What You Need
Requirements and assumed knowledge as follows:
- Already connected to MetaTrader 5. This article shows you how, I’m using the variant from IC Markets.
- Windows 10 or above. For reasons known only to MetaTrader, the Python API only works on Windows 😊
- Python 3. This series was built with Python 3.10
Update August 2023
I could never have anticipated how popular this series, along with a YouTube channel would become.
After a listening to my readers/viewers feedback, I realized that many people were spending huge amounts of time trying to solve installation/configuration problems — rather than experiencing the joy of algorithmic trading.
I want to change this narrative — and in so doing, open up algorithmic trading for everyone.
To do this, I’ve recently launched Tradeoxy: Trading For Everyone.
If you’re reading this, Tradeoxy will simplify 90% of this series, using a series of powerful API’s and easy to use tooling.
Currently it’s in the early-access / building stage and I’d be incredibly grateful if you’d join us on this adventure. Your feedback will help us shape a better product.
Join the early access program (for free) here.
You can also view our launch video, and follow our journey on LinkedIn, Twitter, Instagram, YouTube.
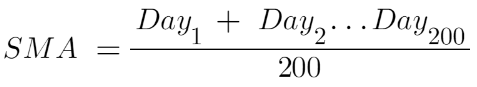
The 200-Day SMA
Introduction to the SMA
The Simple Moving Average (SMA) is a popular signal amongst traders. The signal is often used to indicate the support or resistance to price movements. It’s one of the most common trendlines to be seen on a trading chart.
While the SMA can be calculated on any timeframe, it is commonly applied to the close price of a series of days. The three most common time periods are:
- 50-day SMA
- 100-day SMA
- 200-day SMA
In this episode, I’ll show you how to calculate the 200-day SMA.
How to Calculate
How to Code
Generic SMA Function
The first step will be to build a generic SMA calculator. This will calculate the SMA for a defined number of candles across a specified timeframe. I’ll use Pandas to calculate the average (mean).
Here’s the code:
Note. Check out the mt5_interface.py file if you’re looking for how to connect to MT5.
To demonstrate how this fits into __main__ check out this Gist:
200-Day SMA Function
Abstracting this function, you can create a 200-Day SMA in 2 lines of code (I’ve included the import statement and comments in the code sample below):
If you update your main.py to import simple_ma_200 and __main__ to use this new function, you’ll get an outcome similar to the below (the number will be different depending on what day and symbol you use):
Wrapping Up
All sorted! You can now include a 200-Day SMA into your Python Trading Bot. Let me know in the comments how you plan on using it!
Say Hi!
I love hearing from my readers, so take some time to give me a shout-out. This could be a clap, a follow, or saying “Hi” on LinkedIn 😊
If you’re thinking about signing up for Medium, why not use my referral link? It won’t cost you anything, but Medium does give me a portion of your membership fee ❤
Till next time.


