
120+ Data Scientist Interview Questions and Answers You Should Know in 2021
Interview Questions from Facebook, Yelp, Amazon, Google, Apple, Netflix, and More

2020 wasn’t the greatest year, so I thought why not get a head start for 2021!
This article has over 120 data science interview questions from some of the top tech companies in the world, like Facebook, Google, Yelp, Amazon, and more!
Be sure to subscribe to never miss another article on data science guides, tricks and tips, life lessons, and more!
What makes this article different than my previous ones?
- MORE questions! Instead of 100 questions, this article has over 120 interview questions to help you prep.
- MORE SQL! This time, there are more general SQL questions rather than technical coding questions, as requested.
- MORE deep learning! This time, there are more questions on neural networks and deep learning.
- MORE case studies! There’s a bunch of SQL case studies and business case studies so that you can apply yourself.
- MORE refined! Fewer grammar errors (hopefully), and well, fewer errors in general. More pictures and diagrams!
This is divided into several parts:
- Machine Learning
- SQL
- Statistics, Probability, and Mathematics
- Data & Business Analysis
- Miscellaneous
- Case studies
With that said, good luck!
Machine Learning
Q: What are the assumptions required for linear regression? What if some of these assumptions are violated?
There are four assumptions associated with a linear regression model:
- Linearity: The relationship between X and the mean of Y is linear.
- Homoscedasticity: The variance of the residual is the same for any value of X.
- Independence: Observations are independent of each other.
- Normality: For any fixed value of X, Y is normally distributed.
Extreme violations of these assumptions will make the results redundant. Small violations of these assumptions will result in a greater bias or variance of the estimate.
Q: What is collinearity? What is multicollinearity? How do you deal with it?
Collinearity is a linear association between two predictors. Multicollinearity is a situation where two or more predictors are highly linearly related.
This can be problematic because it undermines the statistical significance of an independent variable. While it may not necessarily have a large impact on the model’s accuracy, it affects the variance of the prediction and reduces the quality of the interpretation of the independent variables.
You could use the Variance Inflation Factors (VIF) to determine if there is any multicollinearity between independent variables — a standard benchmark is that if the VIF is greater than 5 then multicollinearity exists.
Be sure to subscribe to never miss another article on data science guides, tricks and tips, life lessons, and more!
Q: What are the drawbacks of a linear model?
There are a couple of drawbacks of a linear model:
- A linear model holds some strong assumptions that may not be true in application. It assumes a linear relationship, multivariate normality, no or little multicollinearity, no auto-correlation, and homoscedasticity.
- A linear model can’t be used for discrete or binary outcomes.
- You can’t vary the model flexibility of a linear model.
Q: What are ridge and lasso regression and what are the differences between them?
Both L1 and L2 regularization are methods used to reduce the overfitting of training data. Least Squares minimizes the sum of the squared residuals, which can result in low bias but high variance.
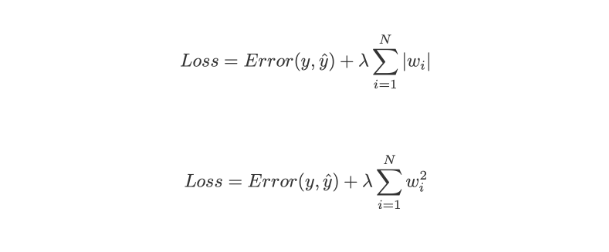
L2 Regularization, also called ridge regression, minimizes the sum of the squared residuals plus lambda times the slope squared. This additional term is called the Ridge Regression Penalty. This increases the bias of the model, making the fit worse on the training data, but also decreases the variance. If you take the ridge regression penalty and replace it with the absolute value of the slope, then you get Lasso regression or L1 regularization.
L2 is less robust but has a stable solution and always one solution. L1 is more robust but has an unstable solution and can possibly have multiple solutions.
Q: How does K-Nearest Neighbor work?
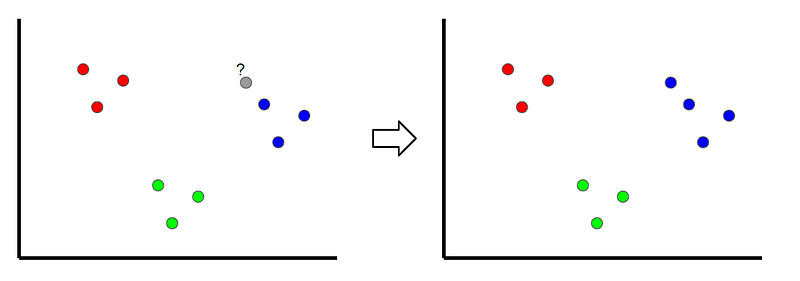
K-Nearest Neighbors is a classification technique where a new sample is classified by looking at the nearest classified points, hence ‘K-nearest’. In the example above, if k=1 then the unclassified point would be classified as a blue point.
If the value of k is too low, it can be subject to outliers. However, if it’s too high, it may overlook classes with only a few samples.
Q: How can you select k for k means?
You can use the elbow method, which is a popular method used to determine the optimal value of k. Essentially, what you do is plot the squared error for each value of k on a graph (value of k on the x-axis and squared error on the y-axis). Once the graph is made, the point where the distortion declines the most is the elbow point.
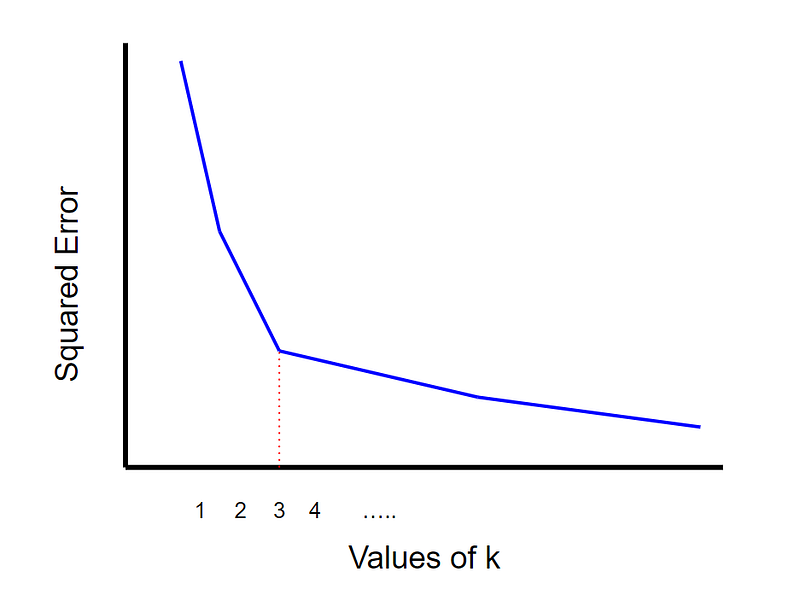
Using the image above as an example, you can see that the elbow occurs when k=3, so k should equal 3.
Q: Why is Naive Bayes “naive”?
Naive Bayes is naive because it holds a strong assumption in that the features are assumed to be uncorrelated with one another, which typically is never the case.
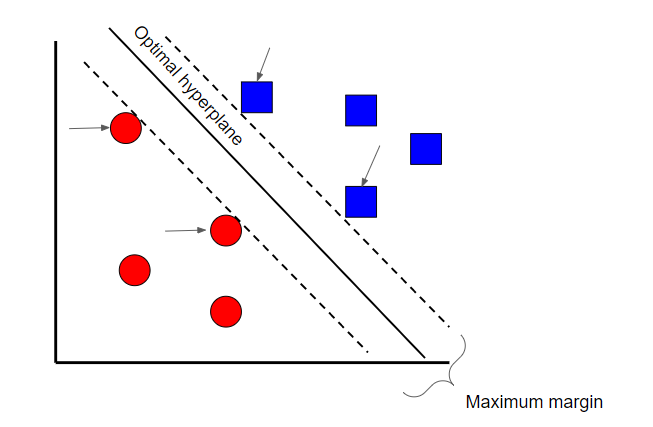
Q: What are the support vectors in SVM?
The support vectors are the data points that touch the boundaries of the maximum margin (see below).
Q: What is pruning in decision trees?
Pruning is a technique in machine learning and search algorithms that reduces the size of decision trees by removing sections or branches of the tree that provide little to no power for classifying instances.
Q: What are random forests? Why is Naive Bayes better?
Random forests are an ensemble learning technique that builds off of decision trees. Random forests involve creating multiple decision trees using bootstrapped datasets of the original data and randomly selecting a subset of variables at each step of the decision tree. The model then selects the mode of all of the predictions of each decision tree. By relying on a “majority wins” model, it reduces the risk of error from an individual tree.
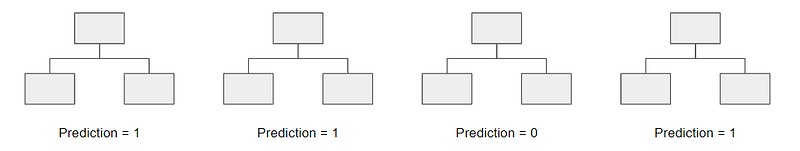
For example, if we created one decision tree, the third one, it would predict 0. But if we relied on the mode of all 4 decision trees, the predicted value would be 1. This is the power of random forests.
Random forests offer several other benefits including strong performance, can model non-linear boundaries, no cross-validation needed, and gives feature importance.
Naive Bayes is better in the sense that it is easy to train and understand the process and results. A random forest can seem like a black box. Therefore, a Naive Bayes algorithm may be better in terms of implementation and understanding. However, in terms of performance, a random forest is typically stronger because it is an ensemble technique.
Q: When would you use random forests Vs SVM and why?
There are a couple of reasons why a random forest is a better choice of an algorithm than a support vector machine:
- Random forests allow you to determine the feature importance. SVM’s can’t do this.
- Random forests are much quicker and simpler to build than an SVM.
- For multi-class classification problems, SVMs require a one-vs-rest method, which is less scalable and more memory intensive.
Q: Do you think 50 small decision trees are better than a large one? Why?
Another way of asking this question is “Is a random forest a better model than a decision tree?” And the answer is yes because a random forest is an ensemble method that takes many weak decision trees to make a strong learner. Random forests are more accurate, more robust, and less prone to overfitting.
Q: What’s the difference between an AdaBoosted tree and a Gradient Boosted tree?
AdaBoost is a boosted algorithm that is similar to Random Forests but has a couple of significant differences:
- Rather than a forest of trees, AdaBoost typically makes a forest of stumps (a stump is a tree with only one node and two leaves).
- Each stump’s decision is not weighted equally in the final decision. Stumps with less total error (high accuracy) will have a higher say.
- The order in which the stumps are created is important, as each subsequent stump emphasizes the importance of the samples that were incorrectly classified in the previous stump.
Gradient Boost is similar to AdaBoost in the sense that it builds multiple trees where each tree is built off of the previous tree. Unlike AdaBoost which builds stumps, Gradient Boost builds trees with usually 8 to 32 leaves.
More importantly, Gradient differs from AdaBoost in the way that the decisions trees are built. Gradient boost starts with an initial prediction, usually the average. Then, a decision tree is built based on the residuals of the samples. A new prediction is made by taking the initial prediction + a learning rate times the outcome of the residual tree, and the process is repeated.
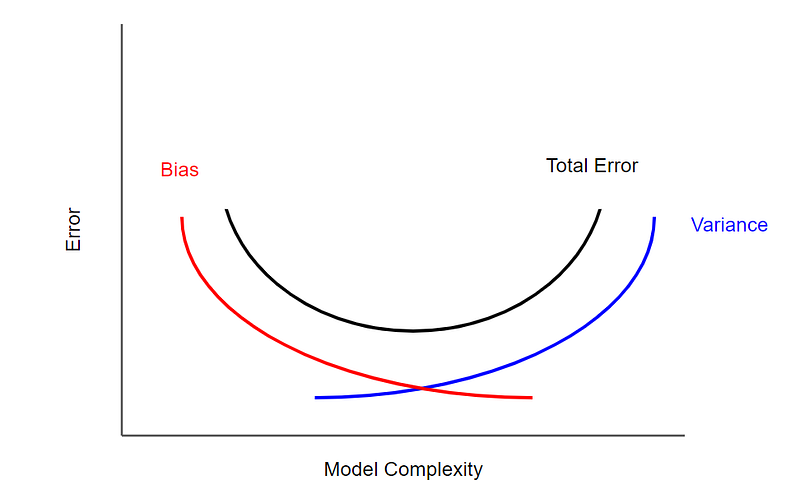
Q: What is the bias-variance tradeoff?
The bias of an estimator is the difference between the expected value and true value. A model with a high bias tends to be oversimplified and results in underfitting. Variance represents the model’s sensitivity to the data and the noise. A model with high variance results in overfitting.
Therefore, the bias-variance tradeoff is a property of machine learning models in which lower variance results in higher bias and vice versa. Generally, an optimal balance of the two can be found in which error is minimized.
Q: Explain what the bootstrap sampling method is and give an example of when it’s used.
Technically speaking, the bootstrap sampling method is a resampling method that uses random sampling with replacement. Read more here.
It’s an essential part of the random forest algorithm, as well as other ensemble learning algorithms.
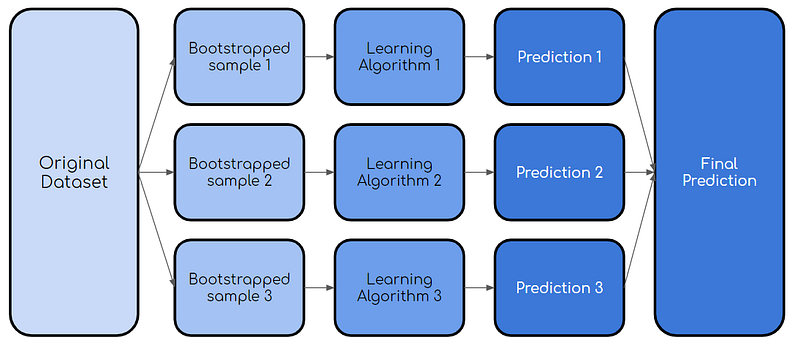
Q: What is the difference between bagging and boosting?
Bagging, also known as bootstrap aggregating, is the process in which multiple models of the same learning algorithm are trained with bootstrapped samples of the original dataset. Then, like the random forest example above, a vote is taken on all of the models’ outputs.
Boosting is a variation of bagging where each individual model is built sequentially, iterating over the previous one. Specifically, any data points that are falsely classified by the previous model is emphasized in the following model. This is done to improve the overall accuracy of the model. Here’s a diagram to make more sense of the process:
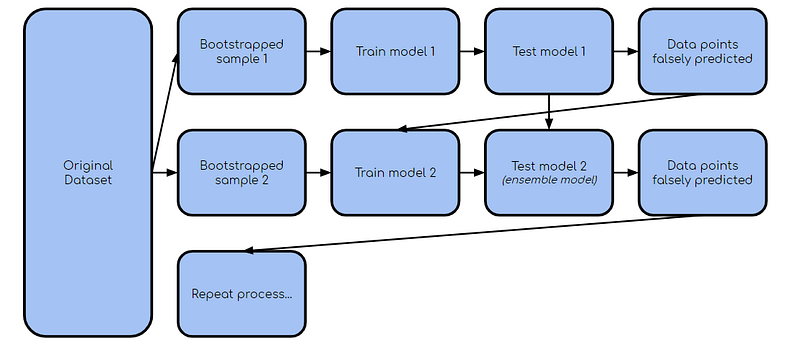
Once the first model is built, the falsely classified/predicted points are taken in addition to the second bootstrapped sample to train the second model. Then, the ensemble model (models 1 and 2) are used against the test dataset and the process continues.
Q: How does XGBoost handle the bias-variance tradeoff?
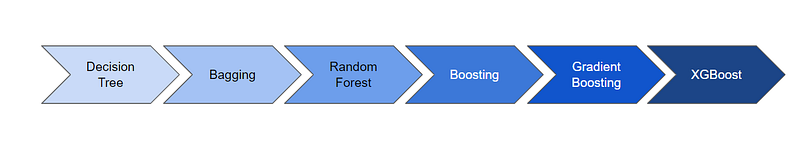
XGBoost is an ensemble Machine Learning algorithm that leverages the gradient boosting algorithm. In essence, XGBoost is like a bagging and boosting technique on steroids. Therefore, you can say that XGBoost handles bias and variance similar to that of any boosting technique. Boosting is an ensemble meta-algorithm that reduces both bias and variance by takes a weighted average of many weak models. By focusing on weak predictions and iterating through models, the error (thus the bias) is reduced. Similarly, because it takes a weighted average of many weak models, the final model has a lower variance than each of the weaker models themselves.
Q: What is cross-validation?
Cross-validation is essentially a technique used to assess how well a model performs on a new independent dataset.
The simplest example of cross-validation is when you split your data into three groups: training data, validation data, and testing data, where you use the training data to build the model, the validation data to tune the hyperparameters, and the testing data to evaluate your final model.
Q: Assume you need to generate a predictive model using multiple regression. Explain how you intend to validate this model.
There are two main ways that you can do this:
A) Adjusted R-squared.
R Squared is a measurement that tells you to what extent the proportion of variance in the dependent variable is explained by the variance in the independent variables. In simpler terms, while the coefficients estimate trends, R-squared represents the scatter around the line of best fit.
However, every additional independent variable added to a model always increases the R-squared value — therefore, a model with several independent variables may seem to be a better fit even if it isn’t. This is where adjusted R² comes in. The adjusted R² compensates for each additional independent variable and only increases if each given variable improves the model above what is possible by probability. This is important since we are creating a multiple regression model.
B) Cross-Validation
A method common to most people is cross-validation, splitting the data into three sets: training, validating, and testing data. See the previous answer.
Q: What is the difference between online and batch learning?
Batch learning, also known as offline learning, is when you learn over groups of patterns. This is the type of learning that most people are familiar with, where you source a dataset and build a model on the whole dataset at once.
Online learning, on the other hand, is an approach that ingests data one observation at a time. Online learning is data-efficient because the data is no longer required once it is consumed, which technically means that you don’t have to store your data.
Q: Give several ways to deal with missing values
There are a number of ways to handle null values including the following:
- You can omit rows with null values altogether
- You can replace null values with measures of central tendency (mean, median, mode) or replace it with a new category (eg. ‘None’)
- You can predict the null values based on other variables. For example, if a row has a null value for weight, but it has a value for height, you can replace the null value with the average weight for that given height.
- Lastly, you can leave the null values if you are using a machine learning model that automatically deals with null values.
Q: Is mean imputation of missing data acceptable practice? Why or why not?
Mean imputation is the practice of replacing null values in a data set with the mean of the data.
Mean imputation is generally bad practice because it doesn’t take into account feature correlation. For example, imagine we have a table showing age and fitness score and imagine that an eighty-year-old has a missing fitness score. If we took the average fitness score from an age range of 15 to 80, then the eighty-year-old will appear to have a much higher fitness score than he actually should.
Second, mean imputation reduces the variance of the data and increases bias in our data. This leads to a less accurate model and a narrower confidence interval due to a smaller variance.
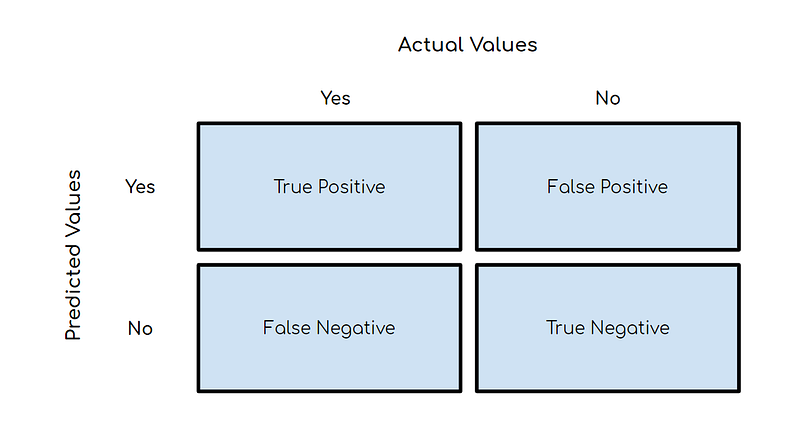
Q: What is a confusion matrix?
A confusion matrix, also known as an error matrix, is a summarized table used to assess the performance of a classification model. The number of correct and incorrect predictions are summarized with count values and broken down by each class.
Q: What is Supervised vs Unsupervised learning?
Supervised learning involves learning on a labeled dataset where the target variable is known.
Unsupervised learning is used to draw inferences and find patterns from input data without references to labeled outcomes — there’s no target variable.
Q: What is ensemble learning?
Ensemble learning is a method where multiple learning algorithms are used in conjunction. The purpose of doing so is that it allows you to achieve higher predictive performance than if you were to use an individual algorithm by itself. An example of this is random forests.
Q: How can you identify outliers?
There are a couple of ways to identify outliers:
Z-score/standard deviations: if we know that 99.7% of data in a data set lie within three standard deviations, then we can calculate the size of one standard deviation, multiply it by 3, and identify the data points that are outside of this range. Likewise, we can calculate the z-score of a given point, and if it’s equal to +/- 3, then it’s an outlier. Note: that there are a few contingencies that need to be considered when using this method; the data must be normally distributed, this is not applicable for small data sets, and the presence of too many outliers can throw off z-score.
Interquartile Range (IQR): IQR, the concept used to build boxplots, can also be used to identify outliers. The IQR is equal to the difference between the 3rd quartile and the 1st quartile. You can then identify if a point is an outlier if it is less than Q1–1.5*IRQ or greater than Q3 + 1.5*IQR. This comes to approximately 2.698 standard deviations.
Other methods include DBScan clustering, Isolation Forests, and Robust Random Cut Forests.
Q: What is an inlier?
An inlier is a data observation that lies within the rest of the dataset and is unusual or an error. Since it lies in the dataset, it is typically harder to identify than an outlier and requires external data to identify them.
Q: How can outliers be treated?
There are a couple of ways:
- Remove outliers if they’re a garbage value.
- You can try a different model. For example, a non-linear model might treat an outlier differently than a linear model.
- You can normalize the data to narrow the range.
- You can use algorithms that account for outliers, such as random forests.
Q: How are collaborative filtering and content-based filtering similar? different?
In content-based filtering, you use the properties of the objects to find similar products. For example, using content-based filtering, a movie recommender may recommend movies of the same genre or movies directed by the same director.
In collaborative filtering, your behavior is compared to other users and users with similar behavior dictate what is recommended to you. To give a very simple example, if you bought a tv and another user bought a tv as well as a recliner, you would be recommended the recliner as well.
Q: What is principal component analysis? Explain the sort of problems you would use PCA for.
In its simplest sense, PCA involves project higher dimensional data (eg. 3 dimensions) to a smaller space (eg. 2 dimensions). This results in a lower dimension of data, (2 dimensions instead of 3 dimensions) while keeping all original variables in the model.
PCA is commonly used for compression purposes, to reduce required memory and to speed up the algorithm, as well as for visualization purposes, making it easier to summarize data.
Q: What is the difference between a validation set and a test set?
Generally, the validation set is used to tune the hyperparameters of your model, while the testing set is used to evaluate your final model.
Q: How can you avoid overfitting your model?
For those who don’t know, overfitting is a modeling error when a function fits the data too closely, resulting in high levels of error when new data is introduced to the model.
There are a number of ways that you can prevent overfitting of a model:
- Cross-validation: Cross-validation is a technique used to assess how well a model performs on a new independent dataset. The simplest example of cross-validation is when you split your data into two groups: training data and testing data, where you use the training data to build the model and the testing data to test the model.
- Regularization: Overfitting occurs when models have higher degree polynomials. Thus, regularization reduces overfitting by penalizing higher degree polynomials.
- Reduce the number of features: You can also reduce overfitting by simply reducing the number of input features. You can do this by manually removing features, or you can use a technique, called Principal Component Analysis, which projects higher dimensional data (eg. 3 dimensions) to a smaller space (eg. 2 dimensions).
- Ensemble Learning Techniques: Ensemble techniques take many weak learners and converts them into a strong learner through bagging and boosting. Through bagging and boosting, these techniques tend to overfit less than their alternative counterparts.
Q: What are some of the steps for data wrangling and data cleaning before applying machine learning algorithms?
There are many steps that can be taken when data wrangling and data cleaning. Some of the most common steps are listed below:
- Data profiling: Almost everyone starts off by getting an understanding of their dataset. More specifically, you can look at the shape of the dataset with .shape and a description of your numerical variables with .describe().
- Data visualizations: Sometimes, it’s useful to visualize your data with histograms, boxplots, and scatterplots to better understand the relationships between variables and also to identify potential outliers.
- Syntax error: This includes making sure there’s no white space, making sure letter casing is consistent, and checking for typos. You can check for typos by using .unique() or by using bar graphs.
- Standardization or normalization: Depending on the dataset your working with and the machine learning method you decide to use, it may be useful to standardize or normalize your data so that different scales of different variables don’t negatively impact the performance of your model.
- Handling null values: There are a number of ways to handle null values including deleting rows with null values altogether, replacing null values with the mean/median/mode, replacing null values with a new category (eg. unknown), predicting the values, or using machine learning models that can deal with null values. Read more here.
- Other things include: removing irrelevant data, removing duplicates, and type conversion.
Q: How should you deal with unbalanced binary classification?
There are a number of ways to handle unbalanced binary classification (assuming that you want to identify the minority class):
- First, you want to reconsider the metrics that you’d use to evaluate your model. The accuracy of your model might not be the best metric to look at because and I’ll use an example to explain why. Let’s say 99 bank withdrawals were not fraudulent and 1 withdrawal was. If your model simply classified every instance as “not fraudulent”, it would have an accuracy of 99%! Therefore, you may want to consider using metrics like precision and recall.
- Another method to improve unbalanced binary classification is by increasing the cost of misclassifying the minority class. By increasing the penalty of such, the model should classify the minority class more accurately.
- Lastly, you can improve the balance of classes by oversampling the minority class or by undersampling the majority class. You can read more about it here.
Q: What is the difference between precision and recall?
Recall attempts to answer “What proportion of actual positives was identified correctly?”

Precision attempts to answer “What proportion of positive identifications was actually correct?”

Q: Why is mean square error a bad measure of model performance? What would you suggest instead?
Mean Squared Error (MSE) gives a relatively high weight to large errors — therefore, MSE tends to put too much emphasis on large deviations. A more robust alternative is MAE (mean absolute deviation).
Q: Explain what a false positive and a false negative are. Why is it important these from each other? Provide examples when false positives are more important than false negatives and when false negatives are more important than false positives.
A false positive is an incorrect identification of the presence of a condition when it’s absent.
A false negative is an incorrect identification of the absence of a condition when it’s actually present.
An example of when false negatives are more important than false positives is when screening for cancer. It’s much worse to say that someone doesn’t have cancer when they do, instead of saying that someone does and later realizing that they don’t.
This is a subjective argument, but false positives can be worse than false negatives from a psychological point of view. For example, a false positive for winning the lottery could be a worse outcome than a false negative because people normally don’t expect to win the lottery anyway.
Q: What are the feature selection methods used to select the right variables?
There are two types of methods for feature selection: filter methods and wrapper methods.
Filter methods include the following:
- Linear discrimination analysis
- ANOVA
- Chi-Square
Wrapper methods include the following:
- Forward Selection: We test one feature at a time and keep adding them until we get a good fit
- Backward Selection: We test all the features and start removing them to see what works better
Q: Briefly explain how a basic neural network works
At its core, a Neural Network is essentially a network of mathematical equations. It takes one or more input variables, and by going through a network of equations, results in one or more output variables.
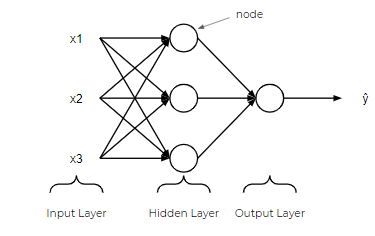
In a neural network, there’s an input layer, one or more hidden layers, and an output layer. The input layer consists of one or more feature variables (or input variables or independent variables) denoted as x1, x2, …, xn. The hidden layer consists of one or more hidden nodes or hidden units. A node is simply one of the circles in the diagram above. Similarly, the output variable consists of one or more output units.
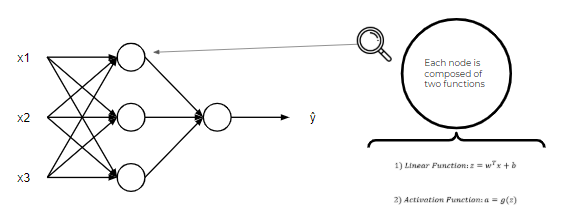
Like I said at the beginning, a neural network is nothing more than a network of equations. Each node in a neural network is composed of two functions, a linear function and an activation function. This is where things can get a little confusing, but for now, think of the linear function as some line of best fit. Also, think of the activation function like a light switch, which results in a number between 1 or 0.
Q: Why is Rectified Linear Unit a good activation function?
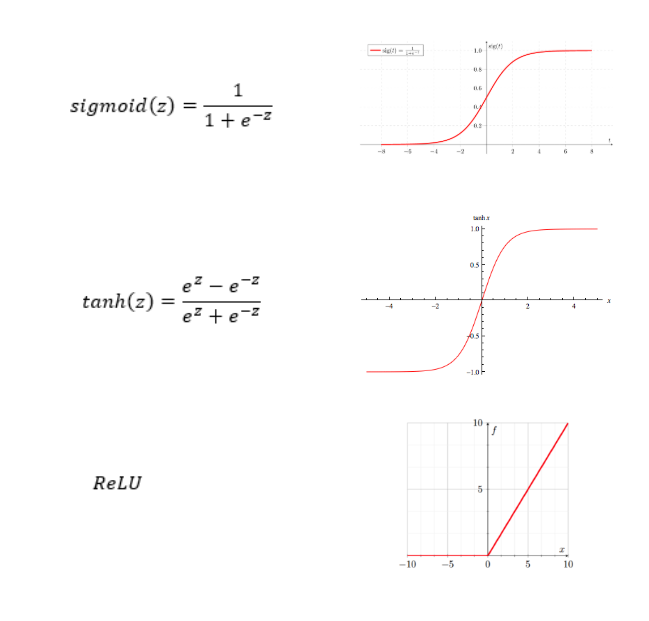
The Rectified Linear Unit, also known as the ReLU function, is known to be a better activation function than the sigmoid function and the tanh function because it performs gradient descent faster. Notice in the image to the left that when x (or z) is very large, the slope is very small, which slows gradient descent significantly. This, however, is not the case for the ReLU function.
Q: How are weights initialized in a Network?
The weights of a neural network MUST be initialized randomly because this is an expectation of stochastic gradient descent.
If you initialized all weights to the same value (i.e. zero or one), then each hidden unit will get exactly the same signal. For example, if all weights are initialized to 0, all hidden units will get zero signal.
Q: What happens if the learning rate is set too high or too low?
If the learning rate is too low, your model will train very slowly as minimal updates are made to the weights through each iteration. Thus, it would take many updates before reaching the minimum point.
If the learning rate is set too high, this causes undesirable divergent behavior to the loss function due to drastic updates in weights, and it may fail to converge.
Q: What are recurrent neural networks?
Recurrent neural networks, also known as RNNs, are a class of neural networks that allow previous outputs to be used as inputs while having hidden states.
They are commonly used to recognize the pattern of sequences in data, including time-series data, stock market data, etc…
Q: What is the role of the activation function?
The purpose of the activation function is to introduce non-linearity into the output of a neuron. The activation function decides whether a neuron should be activated or not by calculating weighted sum and further adding bias with it.
SQL
Q: What is the difference between an aggregation function and a window function?
A window function is like an aggregate function in the sense that it returns aggregate values (eg. SUM(), COUNT(), MAX()).
What makes window functions different is that it does not group the result set. The number of rows in the output is the same as the number of rows in the input.
Q: When will ROW_NUMBER and RANK give different results? Give an example.
ROW_NUMBER and RANK will give different results when there are ties within a partition for a particular ordering value.
Example:
SELECT ROW_NUMBER() OVER(ORDER BY GPA) as ROW_NUMBER
SELECT RANK() OVER(ORDER BY GPA) as RANK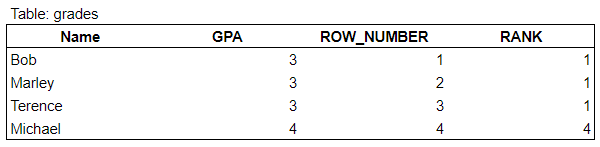
For more questions like this, check out StrataScratch with 100’s of SQL questions.
Q: Is it possible for LEFT JOIN and FULL OUTER JOIN to produce the same results? Why or Why not?
Yes. If every row in the second table can be joined to the first table and every row in the first table can be joined to the second table using a LEFT JOIN, then the result will be the same for a FULL OUTER JOIN.
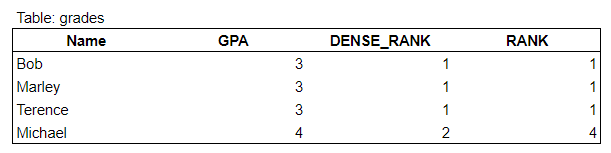
Q: What is the difference between RANK and DENSE_RANK?
RANK gives you the ranking within your ordered partition. Ties are assigned the same rank, with the next ranking(s) skipped. If you see the image below, the next rank after 1 is 4 since 3 rows are ranked 1.
DENSE_RANK also gives you the ranking within your ordered partition, but the ranks are consecutive. No ranks are skipped if there are ranks with multiple items. You can see this in the image below, as Michael is ranked 2 instead of 4 using DENSE_RANK.
Q: What happens if I GROUP BY a column that is not in the SELECT statement? Why does this happen?
Your query will return no results. This is because the column that you are grouping by needs to be included in the SELECT statement so that the query can identify the values for that given column.
Example:
SELECT COUNT(DISTINCT ID)
FROM table
GROUP BY Date
Since Date is not included in the SELECT clause, it will return nothing.
Q: LAG and LEAD are especially useful in what type of scenarios?
LAG and LEAD functions are useful when you want to compare values from different periods. For example, if you want to compare each week’s sales with the previous weeks.
Q: What is the difference between IFNULL and COALESCE?
There are a couple of differences:
- ISNULL is evaluated once only since is a function. On the other hand, the input values for the COALESCE expression can be evaluated multiple times.
- Data type determination of the resulting expression is different for each. ISNULL uses the data type of the first parameter, while COALESCE follows the CASE expression rules and returns the data type of value with the highest precedence.
- Lastly, validations for ISNULL and COALESCE are different. For example, a NULL value for ISNULL is converted to int, unlike COALESCE where you must provide a data type. ISNULL takes only 2 parameters whereas COALESCE takes a variable number of parameters.
Q: Do temp tables make your code cleaner and faster, one of the two, or none? Why?
Generally, temp tables are both faster and cleaner. It is much easier to read and follow than subqueries, and in terms of speed, SQL is optimized to do joins rather than subqueries.
Q: Write SQL queries to find a time difference between two events.
First, you can use the LEAD() or LAG() function to create a new column of dates that you want to compare.
Then, you can use DATEDIFF to get the difference time between the two events.
Q: Does creating a view require storage in a database?
No, A view does not require any storage in a database because it does not exist physically. The only space that would be required for a view is the space to store the definition of the view, not the data that it presents.
Q: How would you handle NULLs when querying a data set?
You can handle NULLs when querying using CASE WHEN statements, IFNULL, or COALESCE.
Statistics, Probability, and Mathematics
Q: What is the p-value defined as?
The p-value is the probability of obtaining the observed results of a test, assuming that the null hypothesis is correct; a smaller p-value means that there is stronger evidence in favor of the alternative hypothesis.
Q: What are covariance and correlation? How are they related?
Covariance is a quantitative measure of the extent to which the deviation of one variable from its mean matches the deviation of the other from its mean.
Correlation is a measurement of the relationship between two variables. It is the covariance of the two variables, normalized by the variance of each variable.
Q: What is the law of large numbers?
The Law of Large Numbers is a theory that states that as the number of trials increases, the average of the result will become closer to the expected value.
Eg. flipping heads from fair coin 100,000 times should be closer to 0.5 than 100 times.
Q: What is the Central Limit Theorem? Explain it. Why is it important?
The central limit theorem states that the sampling distribution of the sample mean approaches a normal distribution as the sample size gets larger no matter what the shape of the population distribution.
The central limit theorem is important because it is used in hypothesis testing and also to calculate confidence intervals.
Q: What is the Markov Property?
When modeling a stochastic process, one in which an agent makes random decisions over time, such an assumption is referred to as the Markov property.
Q: What is statistical power?
‘Statistical power’ refers to the power of a binary hypothesis, which is the probability that the test rejects the null hypothesis given that the alternative hypothesis is true.
Q: What are confounding variables?
A confounding variable, or a confounder, is a variable that influences both the dependent variable and the independent variable, causing a spurious association, a mathematical relationship in which two or more variables are associated but not causally related.
Q: How does experimental data contrast with observational data?
Observational data comes from observational studies which are when you observe certain variables without intervening and try to determine if there is any correlation.
Experimental data comes from experimental studies (with intervention) which are when you control certain variables and hold them constant to determine if there is any causality.
Q: Explain selection bias (with regard to a dataset, not variable selection). Why is it important? How can data management procedures such as missing data handling make it worse?
Selection bias is the phenomenon of selecting individuals, groups, or data for analysis in such a way that proper randomization is not achieved, ultimately resulting in a sample that is not representative of the population.
Understanding and identifying selection bias is important because it can significantly skew results and provide false insights about a particular population group.
Types of selection bias include:
- Sampling bias: a biased sample caused by non-random sampling
- Time interval: selecting a specific time frame that supports the desired conclusion. e.g. conducting a sales analysis near Christmas.
- Exposure: includes clinical susceptibility bias, protopathic bias, indication bias. Read more here.
- Data: includes cherry-picking, suppressing evidence, and the fallacy of incomplete evidence.
- Attrition: attrition bias is similar to survivorship bias, where only those that ‘survived’ a long process are included in an analysis, or failure bias, where those that ‘failed’ are only included
- Observer selection: related to the Anthropic principle, which is a philosophical consideration that any data we collect about the universe is filtered by the fact that, in order for it to be observable, it must be compatible with the conscious and sapient life that observes it.
Handling missing data can make selection bias worse because different methods impact the data in different ways. For example, if you replace null values with the mean of the data, you adding bias in the sense that you’re assuming that the data is not as spread out as it might actually be.
Q: What is the difference between interpolation and extrapolation and why does it matter?
Interpolation is when a prediction is made using inputs that lie within the set of observed values.
Extrapolation is when a prediction is made using an input that’s outside of the set of observed values.
It’s important to know the distinction because interpolations are generally more accurate than extrapolations.
Q: Give an example where the median is a better measure than the mean
When there are a number of outliers that positively or negatively skew the data.
Q: What is survivorship bias?
The phenomenon where only those that ‘survived’ a long process are included or excluded in an analysis, thus creating a biased sample.
A great example provided by Sreenivasan Chandrasekar is the following:
“We enroll for gym membership and attend for a few days. We see the same faces of many people who are fit, motivated and exercising everyday whenever we go to gym. After a few days we become depressed why we aren’t able to stick to our schedule and motivation more than a week when most of the people who we saw at gym could. What we didn’t see was that many of the people who had enrolled for gym membership had also stopped turning up for gym just after a week and we didn’t see them.”
Q: Walk me through the probability fundamentals
Eight rules of probability
- Rule #1: For any event A, 0 ≤ P(A) ≤ 1; in other words, the probability of an event can range from 0 to 1.
- Rule #2: The sum of the probabilities of all possible outcomes always equals 1.
- Rule #3: P(not A) = 1 — P(A); This rule explains the relationship between the probability of an event and its complement event. A complement event is one that includes all possible outcomes that aren’t in A.
- Rule #4: If A and B are disjoint events (mutually exclusive), then P(A or B) = P(A) + P(B); this is called the addition rule for disjoint events
- Rule #5: P(A or B) = P(A) + P(B) — P(A and B); this is called the general addition rule.
- Rule #6: If A and B are two independent events, then P(A and B) = P(A) * P(B); this is called the multiplication rule for independent events.
- Rule #7: The conditional probability of event B given event A is P(B|A) = P(A and B) / P(A)
- Rule #8: For any two events A and B, P(A and B) = P(A) * P(B|A); this is called the general multiplication rule
Counting Methods
Factorial Formula: n! = n x (n -1) x (n — 2) x … x 2 x 1 Use when the number of items is equal to the number of places available. Eg. Find the total number of ways 5 people can sit in 5 empty seats. = 5 x 4 x 3 x 2 x 1 = 120
Fundamental Counting Principle (multiplication) This method should be used when repetitions are allowed and the number of ways to fill an open place is not affected by previous fills. Eg. There are 3 types of breakfasts, 4 types of lunches, and 5 types of desserts. The total number of combinations is = 5 x 4 x 3 = 60
Permutations: P(n,r)= n! / (n−r)! This method is used when replacements are not allowed and order of item ranking matters. Eg. A code has 4 digits in a particular order and the digits range from 0 to 9. How many permutations are there if one digit can only be used once? P(n,r) = 10!/(10–4)! = (10x9x8x7x6x5x4x3x2x1)/(6x5x4x3x2x1) = 5040
Combinations Formula: C(n,r)=(n!)/[(n−r)!r!] This is used when replacements are not allowed and the order in which items are ranked does not matter. Eg. To win the lottery, you must select the 5 correct numbers in any order from 1 to 52. What is the number of possible combinations? C(n,r) = 52! / (52–5)!5! = 2,598,960
Q: What is root cause analysis? How can you identify a cause vs. a correlation? Give examples.
Root cause analysis is a method of problem-solving used for identifying the root cause(s) of a problem
You can identify a correlation using simple data analyses. You can then identify causation by conducting an experiment so that all other variables are isolated (ideally).
Q: You are at a Casino and have two dices to play with. You win $10 every time you roll a 5. If you play till you win and then stop, what is the expected payout?
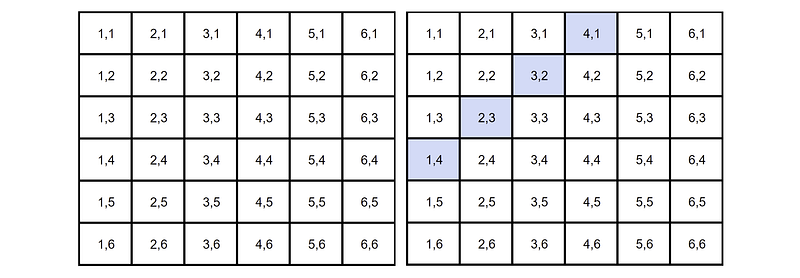
Let’s assume that it costs $5 every time you want to play.
There are 36 possible combinations with two dice. Of the 36 combinations, there are 4 combinations that result in rolling a five (see blue). This means that there is a 4/36 or 1/9 chance of rolling a 5.
A 1/9 chance of winning means you’ll lose eight times and win once (theoretically).
Therefore, your expected payout is equal to $10.00 * 1 — $5.00 * 9= -$35.00.
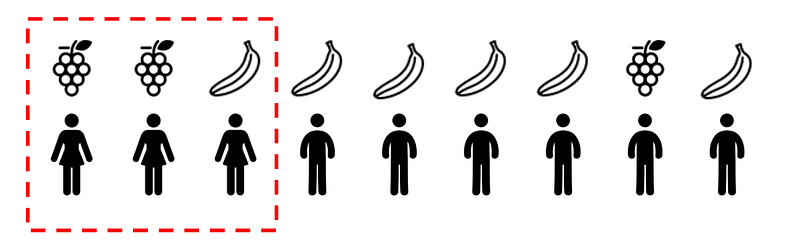
Q: Give me 3 types of statistical biases and explain each of them with an example.
- Sampling bias refers to a biased sample caused by non-random sampling. To give an example, imagine that there are 10 people in a room and you ask if they prefer grapes or bananas. If you only surveyed the three females and concluded that the majority of people like grapes, you’d have demonstrated sampling bias.
- Confirmation bias: the tendency to favour information that confirms one’s beliefs.
- Survivorship bias: the phenomenon where only those that ‘survived’ a long process are included or excluded in an analysis, thus creating a biased sample.
Q: Explain what a long-tailed distribution is and provide three examples of relevant phenomena that have long tails. Why are they important in classification and regression problems?
A long-tailed distribution is a type of heavy-tailed distribution that has a tail (or tails) that drop off gradually and asymptotically.
3 practical examples include the power law, the Pareto principle (more commonly known as the 80–20 rule), and product sales (i.e. best selling products vs others).
It’s important to be mindful of long-tailed distributions in classification and regression problems because the least frequently occurring values make up the majority of the population. This can ultimately change the way that you deal with outliers, and it also conflicts with some machine learning techniques with the assumption that the data is normally distributed.
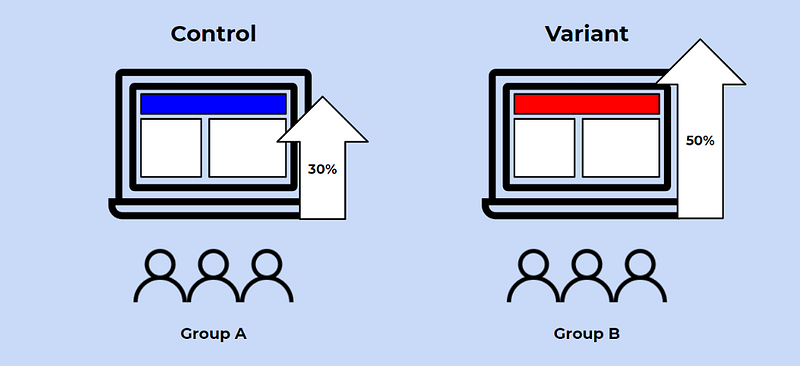
Q: What is A/B testing? When is it used in practice?
A/B Testing is a statistical hypothesis testing meant for a randomized experiment with two variables, A and B. It is commonly used in product development and marketing.
Q: How do you control for biases?
There are many things that you can do to control and minimize bias. Two common things include randomization, where participants are assigned by chance, and random sampling, sampling in which each member has an equal probability of being chosen.
Q: Given two fair dices, what is the probability of getting scores that sum to 4? to 8?
There are 4 combinations of rolling a 4 (1+3, 3+1, 2+2): P(rolling a 4) = 3/36 = 1/12
There are combinations of rolling an 8 (2+6, 6+2, 3+5, 5+3, 4+4): P(rolling an 8) = 5/36
Q: Give examples of data that does not have a Gaussian distribution, nor log-normal.
- Any type of categorical data won’t have a gaussian distribution or lognormal distribution.
- Exponential distributions — eg. the amount of time that a car battery lasts or the amount of time until an earthquake occurs.
Q: How do you assess the statistical significance of an insight?
You would perform hypothesis testing to determine statistical significance. First, you would state the null hypothesis and alternative hypothesis. Second, you would calculate the p-value, the probability of obtaining the observed results of a test assuming that the null hypothesis is true. Last, you would set the level of the significance (alpha) and if the p-value is less than the alpha, you would reject the null — in other words, the result is statistically significant.
Q: The homicide rate in Scotland fell last year to 99 from 115 the year before. Is this reported change really noteworthy?
Since this is a Poisson distribution question, mean = lambda = variance, which also means that standard deviation = square root of the mean.
- a 95% confidence interval implies a z score of 1.96
- one standard deviation = sqrt(115) = 10.724
Therefore the confidence interval = 115+/- 21.45 = [93.55, 136.45]. Since 99 is within this confidence interval, we can assume that this change is not very noteworthy.
Q: How many ways can you draw 6 cards from a deck of 52 cards?

Q: If a variable has 3 different categories (vanilla, chocolate, strawberry), what is the minimum number of dummy variables required to represent it?
You would need 2 dummy variables to represent 3 different categories. For example:
- Chocolate → x1=1, x2=0
- Vanilla → x1=0, x2=1
- Strawberry → x1=0, x2=0
Q: What is the difference between a boxplot and a histogram?
While boxplots and histograms are visualizations used to show the distribution of the data, they communicate information differently.
Histograms are bar charts that show the frequency of a numerical variable’s values and are used to approximate the probability distribution of the given variable. It allows you to quickly understand the shape of the distribution, the variation, and potential outliers.
Boxplots communicate different aspects of the distribution of data. While you can’t see the shape of the distribution through a box plot, you can gather other information like the quartiles, the range, and outliers. Boxplots are especially useful when you want to compare multiple charts at the same time because they take up less space than histograms.
Q: What is the meaning of ACF and PACF?
To understand ACF and PACF, you first need to know what autocorrelation or serial correlation is. Autocorrelation looks at the degree of similarity between a given time series and a lagged version of itself.
Therefore, the autocorrelation function (ACF) is a tool that is used to find patterns in the data, specifically in terms of correlations between points separated by various time lags. For example, ACF(0)=1 means that all data points are perfectly correlated with themselves and ACF(1)=0.9 means that the correlation between one point and the next one is 0.9.
The PACF is short for partial autocorrelation function. Quoting a text from StackExchange, “It can be thought as the correlation between two points that are separated by some number of periods n, but with the effect of the intervening correlations removed.” For example. If T1 is directly correlated with T2 and T2 is directly correlated with T3, it would appear that T1 is correlated with T3. PACF will remove the intervening correlation with T2.
Q: How would you design an experiment for a new feature we’re thinking about. What metrics would matter?
I would conduct an A/B test to determine if the introduction of a new feature results in a statistically significant improvement in a given metric that we care about. The metric(s) chosen depends on the goal of the feature. For example, a feature may be introduced to increase conversion rates, or web traffic, or retention rates.
First I would formulate my null hypothesis (feature X will not improve metric A) and my alternative hypothesis (feature X will improve metric A).
Next, I would create my control and test group through random sampling. Because the t-test inherently considers the sample size, I’m not going to specify a necessary sample size, although the larger the better.
Once I collect my data, depending on the characteristics of my data, I’d then conduct a t-test, Welch’s t-test, chi-squared test, or a Bayesian A/B test to determine whether the differences between my control and test group are statistically significant.
Q: In any 15-minute interval, there is a 20% probability that you will see at least one shooting star. What is the probability that you see at least one shooting star in the period of an hour?
The probability of not seeing any shooting star in 15 minutes:
= 1 — P( Seeing one shooting star ) = 1–0.2 = 0.8
The probability of not seeing any shooting star in the period of one hour:
= (0.8) ^ 4 = 0.4096
The probability of seeing at least one shooting star in the one hour:
= 1 — P( Not seeing any star ) = 1–0.4096 = 0.5904
Q: You randomly draw a coin from 100 coins — 1 unfair coin (head-head), 99 fair coins (head-tail) and roll it 10 times. If the result is 10 heads, what is the probability that the coin is unfair?
This can be answered using the Bayes Theorem. The extended equation for the Bayes Theorem is the following:
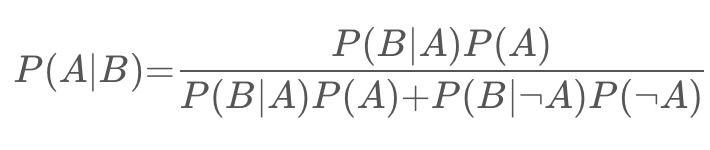
Assume that the probability of picking the unfair coin is denoted as P(A) and the probability of flipping 10 heads in a row is denoted as P(B). Then P(B|A) is equal to 1, P(B∣¬A) is equal to 0.⁵¹⁰, and P(¬A) is equal to 0.99.
If you fill in the equation, then P(A|B) = 0.9118 or 91.18%.
Q: How can you generate a random number between 1–7 with only a die?
If you roll a die twice and consider the event of two rolls, there are 36 different outcomes. If we exclude the combination (6,6), there will be 35 possible outcomes. You can then assign 5 combinations to each number from 1 to 7.
Q: There’s a game where you are given two fair six-sided dice and asked to roll. If the sum of the values on the dice equals seven, then you win $21. However, you must pay $5 to play each time you roll both dice. Do you play this game?
The odds of rolling a 7 is 1/6. This means that you are expected to pay $30 (5*6) to win $21. Take these two numbers and the expected payout is -$9 (21–30). Since the expected payout is negative, you should not play this game.
Q: We have two options for serving ads within Newsfeed. Option 1: 1 out of every 25 stories, one will be ad. Option 2: every story has a 4% chance of being an ad. For each option, what is the expected number of ads shown in 100 news stories?
The expected number of odds for both options is 4 out of 100.
For Option 1, 1/25 is equivalent to 4/100. For Option 2, 4% of 100 is 4/100.
Q: If there are 8 marbles of equal weight and 1 marble that weighs a little bit more (for a total of 9 marbles), how many weighings are required to determine which marble is the heaviest?
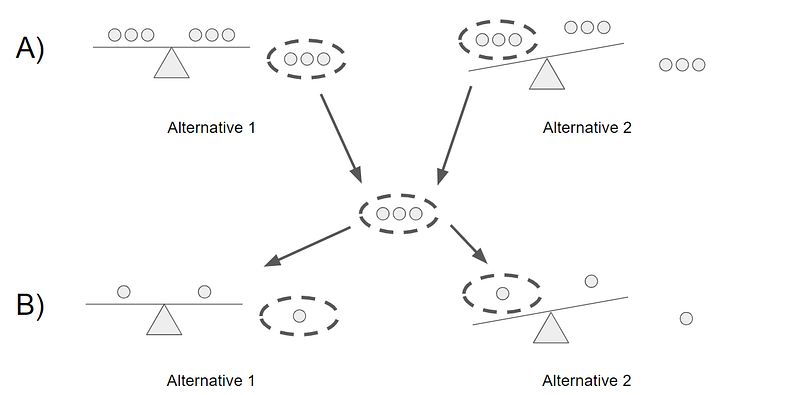
Two weighings would be required (see part A and B above):
- You would split the nine marbles into three groups of three and weigh two of the groups. If the scale balances (alternative 1), you know that the heavy marble is in the third group of marbles. Otherwise, you’ll take the group that is weighed more heavily (alternative 2).
- Then you would exercise the same step, but you’d have three groups of one marble instead of three groups of three.
Q: The probability that item an item at location A is 0.6, and 0.8 at location B. What is the probability that item would be found on Amazon website?
We need to make some assumptions about this question before we can answer it. Let’s assume that there are two possible places to purchase a particular item on Amazon and the probability of finding it at location A is 0.6 and B is 0.8. The probability of finding the item on Amazon can be explained as so:
We can reword the above as P(A) = 0.6 and P(B) = 0.8. Furthermore, let’s assume that these are independent events, meaning that the probability of one event is not impacted by the other. We can then use the formula…
P(A or B) = P(A) + P(B) — P(A and B) P(A or B) = 0.6 + 0.8 — (0.6*0.8) P(A or B) = 0.92
Q: How do you prove that males are on average taller than females by knowing just gender height?
You can use hypothesis testing to prove that males are taller on average than females.
The null hypothesis would state that males and females are the same height on average, while the alternative hypothesis would state that the average height of males is greater than the average height of females.
Then you would collect a random sample of heights of males and females and use a t-test to determine if you reject the null or not.
Q: If a PM says that they want to double the number of ads in Newsfeed, how would you figure out if this is a good idea or not?
You can perform an A/B test by splitting the users into two groups: a control group with the normal number of ads and a test group with double the number of ads. Then you would choose the metric to define what a “good idea” is. For example, we can say that the null hypothesis is that doubling the number of ads will reduce the time spent on Facebook and the alternative hypothesis is that doubling the number of ads won’t have any impact on the time spent on Facebook. However, you can choose a different metric like the number of active users or the churn rate. Then you would conduct the test and determine the statistical significance of the test to reject or not reject the null.
Q: A box has 12 red cards and 12 black cards. Another box has 24 red cards and 24 black cards. You want to draw two cards at random from one of the two boxes, one card at a time. Which box has a higher probability of getting cards of the same color and why?
The box with 24 red cards and 24 black cards has a higher probability of getting two cards of the same color. Let’s walk through each step.
Let’s say the first card you draw from each deck is a red Ace.
This means that in the deck with 12 reds and 12 blacks, there’s now 11 reds and 12 blacks. Therefore your odds of drawing another red are equal to 11/(11+12) or 11/23.
In the deck with 24 reds and 24 blacks, there would then be 23 reds and 24 blacks. Therefore your odds of drawing another red are equal to 23/(23+24) or 23/47.
Since 23/47 > 11/23, the second deck with more cards has a higher probability of getting the same two cards.
Q: How can you tell if a given coin is biased?
This isn’t a trick question. The answer is simply to perform a hypothesis test:
- The null hypothesis is that the coin is not biased and the probability of flipping heads should equal 50% (p=0.5). The alternative hypothesis is that the coin is biased and p != 0.5.
- Flip the coin 500 times.
- Calculate Z-score (if the sample is less than 30, you would calculate the t-statistics).
- Compare against alpha (two-tailed test so 0.05/2 = 0.025).
- If p-value > alpha, the null is not rejected and the coin is not biased. If p-value < alpha, the null is rejected and the coin is biased.
Q: Make an unfair coin fair
Since a coin flip is a binary outcome, you can make an unfair coin fair by flipping it twice. If you flip it twice, there are two outcomes that you can bet on: heads followed by tails or tails followed by heads.
P(heads) * P(tails) = P(tails) * P(heads)
This makes sense since each coin toss is an independent event. This means that if you get heads → heads or tails → tails, you would need to reflip the coin.
Q: You are given 40 cards with four different colors- 10 Green cards, 10 Red Cards, 10 Blue cards, and 10 Yellow cards. The cards of each color are numbered from one to ten. Two cards are picked at random. Find out the probability that the cards picked are not of the same number and same color.
Since these events are not independent, we can use the rule: P(A and B) = P(A) * P(B|A) ,which is also equal to P(not A and not B) = P(not A) * P(not B | not A)
For example:
P(not 4 and not yellow) = P(not 4) * P(not yellow | not 4) P(not 4 and not yellow) = (36/39) * (27/36) P(not 4 and not yellow) = 0.692
Therefore, the probability that the cards picked are not the same number and the same color is 69.2%.
Q: Infection rates at a hospital above a 1 infection per 100 person-days at risk are considered high. A hospital had 10 infections over the last 1787 person-days at risk. Give the p-value of the correct one-sided test of whether the hospital is below the standard.
Since we looking at the number of events (# of infections) occurring within a given timeframe, this is a Poisson distribution question.
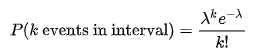
Null (H0): 1 infection per person-days Alternative (H1): >1 infection per person-days
k (actual) = 10 infections lambda (theoretical) = (1/100)*1787 p = 0.032372 or 3.2372% calculated using .poisson() in excel or ppois in R
Since p-value < alpha (assuming 5% level of significance), we reject the null and conclude that the hospital is below the standard.
Q: You roll a biased coin (p(head)=0.8) five times. What’s the probability of getting three or more heads?
Use the General Binomial Probability formula to answer this question:

p = 0.8 n = 5 k = 3,4,5
P(3 or more heads) = P(3 heads) + P(4 heads) + P(5 heads) = 0.94 or 94%
Q: Consider the number of people that show up at a bus station is Poisson with a mean of 2.5/h. What is the probability that at most three people show up in a four hour period?
x = 3 mean = 2.5*4 = 10
using Excel…
p = poisson.dist(3,10,true) p = 0.010336
Q: An HIV test has a sensitivity of 99.7% and a specificity of 98.5%. A subject from a population of prevalence 0.1% receives a positive test result. What is the precision of the test (i.e the probability he is HIV positive)?
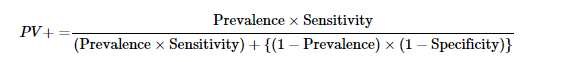
Precision = Positive Predictive Value = PV PV = (0.001*0.997)/[(0.001*0.997)+((1–0.001)*(1–0.985))] PV = 0.0624 or 6.24%
Q: You are running for office and your pollster polled hundred people. Sixty of them claimed they will vote for you. Can you relax?
- Assume that there’s only you and one other opponent.
- Also, assume that we want a 95% confidence interval. This gives us a z-score of 1.96.
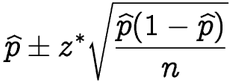
p-hat = 60/100 = 0.6 z* = 1.96 n = 100 This gives us a confidence interval of [50.4,69.6]. Therefore, given a confidence interval of 95%, if you are okay with the worst scenario of tying then you can relax. Otherwise, you cannot relax until you got 61 out of 100 to claim yes.
Q: Geiger counter records 100 radioactive decays in 5 minutes. Find an approximate 95% interval for the number of decays per hour.
- Since this is a Poisson distribution question, mean = lambda = variance, which also means that standard deviation = square root of the mean
- a 95% confidence interval implies a z score of 1.96
- one standard deviation = 10
Therefore the confidence interval = 100 +/- 19.6 = [964.8, 1435.2]
Q: The homicide rate in Scotland fell last year to 99 from 115 the year before. Is this reported change really noteworthy?
- Since this is a Poisson distribution question, mean = lambda = variance, which also means that standard deviation = square root of the mean
- a 95% confidence interval implies a z score of 1.96
- one standard deviation = sqrt(115) = 10.724
Therefore the confidence interval = 115+/- 21.45 = [93.55, 136.45]. Since 99 is within this confidence interval, we can assume that this change is not very noteworthy.
Q: Consider influenza epidemics for two-parent heterosexual families. Suppose that the probability is 17% that at least one of the parents has contracted the disease. The probability that the father has contracted influenza is 12% while the probability that both the mother and father have contracted the disease is 6%. What is the probability that the mother has contracted influenza?
Using the General Addition Rule for probability: P(mother or father) = P(mother) + P(father) — P(mother and father) P(mother) = P(mother or father) + P(mother and father) — P(father) P(mother) = 0.17 + 0.06–0.12 P(mother) = 0.11
Q: In a population of interest, a sample of 9 men yielded a sample average brain volume of 1,100cc and a standard deviation of 30cc. What is a 95% Student’s T confidence interval for the mean brain volume in this new population?
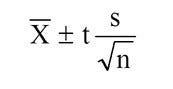
Given a confidence level of 95% and degrees of freedom equal to 8, the t-score = 2.306
Confidence interval = 1100 +/- 2.306*(30/3) Confidence interval = [1076.94, 1123.06]
Q: A diet pill is given to 9 subjects over six weeks. The average difference in weight (follow up — baseline) is -2 pounds. What would the standard deviation of the difference in weight have to be for the upper endpoint of the 95% T confidence interval to touch 0?
Upper bound = mean + t-score*(standard deviation/sqrt(sample size)) 0 = -2 + 2.306*(s/3) 2 = 2.306 * s / 3 s = 2.601903 Therefore the standard deviation would have to be at least approximately 2.60 for the upper bound of the 95% T confidence interval to touch 0.
Data & Business Analysis
Q: If 70% of Facebook users on iOS use Instagram, but only 35% of Facebook users on Android use Instagram, how would you investigate the discrepancy?
There are a number of possible variables that can cause such a discrepancy that I would check to see:
- The demographics of iOS and Android users might differ significantly. For example, according to Hootsuite, 43% of females use Instagram as opposed to 31% of men. If the proportion of female users for iOS is significantly larger than for Android then this can explain the discrepancy (or at least a part of it). This can also be said for age, race, ethnicity, location, etc…
- Behavioral factors can also have an impact on the discrepancy. If iOS users use their phones more heavily than Android users, it’s more likely that they’ll indulge in Instagram and other apps than someone who spent significantly less time on their phones.
- Another possible factor to consider is how Google Play and the App Store differ. For example, if Android users have significantly more apps (and social media apps) to choose from, that may cause greater dilution of users.
- Lastly, any differences in the user experience can deter Android users from using Instagram compared to iOS users. If the app is more buggy for Android users than iOS users, they’ll be less likely to be active on the app.
Q: Likes, users, and minutes spent on a platform are increasing but the total number of users is decreasing. What could be the root cause of it?
Generally, you would want to probe the interviewer for more information but let’s assume that this is the only information that he/she is willing to give.
Focusing on likes per user, there are two reasons why this would have gone up. The first reason is that the engagement of users has generally increased on average over time — this makes sense because as time passes, active users are more likely to be loyal users as using the platform becomes a habitual practice. The other reason why likes per user would increase is that the denominator, the total number of users, is decreasing. Assuming that users that stop using the platform are inactive users, aka users with little engagement and fewer likes than average, this would increase the average number of likes per user.
The explanation above can also be applied to minutes spent on the platform. Active users are becoming more engaged over time, while users with little usage are becoming inactive. Overall the increase in engagement outweighs the users with little engagement.
To take it a step further, it’s possible that the ‘users with little engagement’ are bots that Facebook has been able to detect. But over time, Facebook has been able to develop algorithms to spot and remove bots. If were a significant number of bots before, this can potentially be the root cause of this phenomenon.
Q: Facebook sees that likes are up 10% year over year, why could this be?
The total number of likes in a given year is a function of the total number of users and the average number of likes per user (which I’ll refer to as engagement).
Some potential reasons for an increase in the total number of users are the following: users acquired due to international expansion and younger age groups signing up for Facebook as they get older.
Some potential reasons for an increase in engagement are an increase in usage of the app from users that are becoming more and more loyal, new features and functionality, and an improved user experience.
Q: How would the change of prime membership fee affect the market?
Let’s take the instance where there’s an increase in the prime membership fee — there are two parties involved, the buyers and the sellers.
For the buyers, the impact of an increase in a prime membership fee ultimately depends on the price elasticity of demand for the buyers. If the price elasticity is high, then a given increase in price will result in a large drop in demand and vice versa. Buyers that continue to purchase a membership fee are likely Amazon’s most loyal and active customers — they are also likely to place a higher emphasis on products with prime.
Sellers will take a hit, as there is now a higher cost of purchasing Amazon’s basket of products. That being said, some products will take a harder hit while others may not be impacted. It is likely that premium products that Amazon’s most loyal customers purchase would not be affected as much, like electronics.
Q: How to define/select metrics?
There isn’t a one-size-fits-all metric. The metric(s) chosen to evaluate a machine learning model depends on various factors:
- Is it a regression or classification task?
- What is the business objective? Eg. precision vs recall
- What is the distribution of the target variable?
There are a number of metrics that can be used, including adjusted r-squared, MAE, MSE, accuracy, recall, precision, f1 score, and the list goes on.
Q: You are compiling a report for user content uploaded every month and notice a spike in uploads in October. In particular, a spike in picture uploads. What might you think is the cause of this, and how would you test it?
There are a number of potential reasons for a spike in photo uploads:
- A new feature may have been implemented in October which involves uploading photos and gained a lot of traction by users. For example, a feature that gives the ability to create photo albums.
- Similarly, it’s possible that the process of uploading photos before was not intuitive and was improved in the month of October.
- There may have been a viral social media movement that involved uploading photos that lasted for all of October. Eg. Movember but something more scalable.
- It’s possible that the spike is due to people posting pictures of themselves in costumes for Halloween.
The method of testing depends on the cause of the spike, but you would conduct hypothesis testing to determine if the inferred cause is the actual cause.
Miscellaneous
Q: Define the following terms: lift, KPI, robustness, model fitting, design of experiments, 80/20 rule?
Lift: lift is a measure of the performance of a targeting model measured against a random choice targeting model; in other words, lift tells you how much better your model is at predicting things than if you had no model.
KPI stands for Key Performance Indicator, which is a measurable metric used to determine how well a company is achieving its business objectives. Eg. error rate.
Robustness: generally robustness refers to a system’s ability to handle variability and remain effective.
Model fitting: refers to how well a model fits a set of observations.
Design of experiments: also known as DOE, it is the design of any task that aims to describe and explain the variation of information under conditions that are hypothesized to reflect the variable. [4] In essence, an experiment aims to predict an outcome based on a change in one or more inputs (independent variables).
80/20 rule: also known as the Pareto principle; states that 80% of the effects come from 20% of the causes. Eg. 80% of sales come from 20% of customers.
Q: Define quality assurance and six sigma.
Quality assurance: an activity or set of activities focused on maintaining a desired level of quality by minimizing mistakes and defects.
Six sigma: a specific type of quality assurance methodology composed of a set of techniques and tools for process improvement. A six sigma process is one in which 99.99966% of all outcomes are free of defects.
Case Studies
Case Study 1: Investigating a Drop in User Engagement
To open Mode’s SQL editor, go to this link and click on the hyperlink where it says ‘Open another window to Mode’.
The objective of this case is to determine the cause for a drop in user engagement for Yammer’s project. Before diving into the data, you should read the overview of what Yammer does here. There are 4 tables that you should work with.
The link to the case will provide you with much more detail pertaining to the problem, the data, and the questions that should be answered.
Check out how I approached this case study here if you’d like guidance.
Case Study 2: Understanding Search Functionality
This case is more focused on product analytics. Here, you’ll be required to dive into the data and determine whether the user experience is good or bad. What makes this case interesting is that it’s up to you to determine what ‘good’ and ‘bad’ means and how the user experience will be evaluated.
Case Study 3: Validating A/B Test Results
One of the most practical data science applications is performing A/B tests. In this case study, you’ll dive into the results of an A/B test where there was a 50% difference between the control and treatment groups. Your task for this case is to validate or invalidate the results after a thorough analysis.
Thanks for Reading!
If you enjoyed this, be sure to subscribe to never miss another article on data science guides, tricks and tips, life lessons, and more!
Congrats! You made it to the end. I hope you found this useful, as I spent HOURS working on this. Let me know what you would like to see more of next time in the comments.
As always, I wish you the best in your data science endeavors!
Not sure what to read next? I’ve picked another article for you:
Check out StrataScratch for more data science interview questions:
Terence Shin
- If you enjoyed this, SUBSCRIBE to my Medium for exclusive content!
- Let’s connect on LinkedIn
- Interested in collaborating? Check out my website.


