11 new features in Android Studio 🔰Hedgehog
👨🏻💻Who is this for?
This course is for Android developers who want to know what’s new in Android Studio Hedgehog.
🧩Covered concepts
- Analyze Android vitals in App Quality Insights
- New Power Profiler
- New Android App Links Assistant
- Live Edit updated manual mode shortcut
- Compose Multipreview templates
- Compose Preview Gallery mode
- Compose state information in debugger
- Device mirroring
- Manage devices directly from the Running Devices window
- Embedded Layout Inspector
- New UI improvements
🔰Analyze Android vitals in App Quality Insights
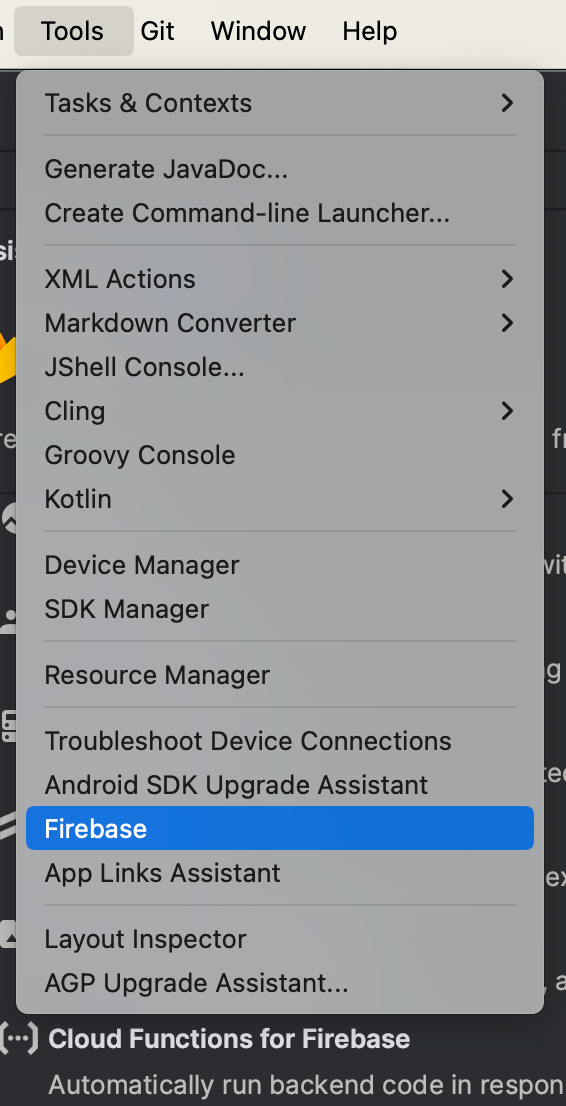
Sign in to your developer accoutn in Android Studio and Open App Quality Insights
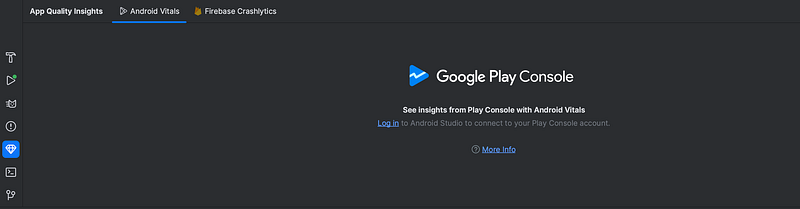
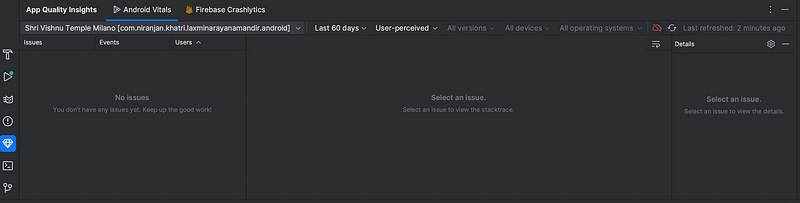
App Quality Insights now includes Android vitals data, so you can more easily access core metrics collected by Google Play and improve your user experience. Use Android vitals to address issues related to app stability, performance, battery usage, and more to help users and maximize the discoverability of your app on Google Play. You can learn more about this in detail here:
🔰New Power Profiler
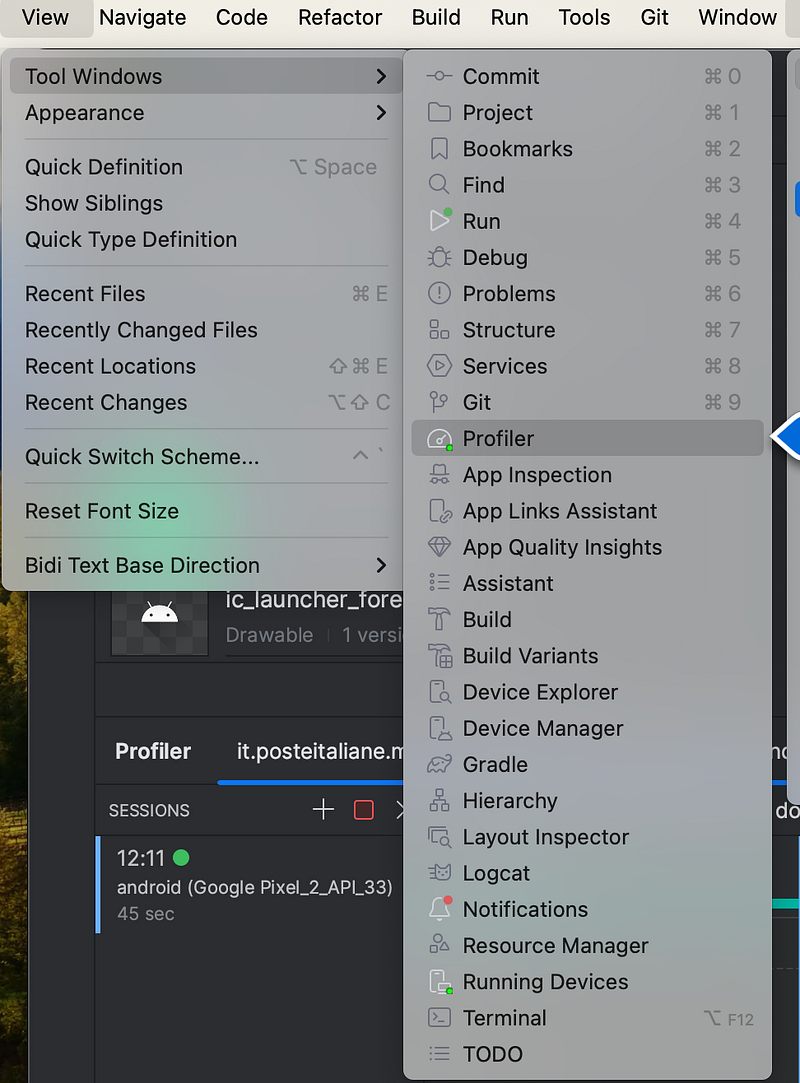
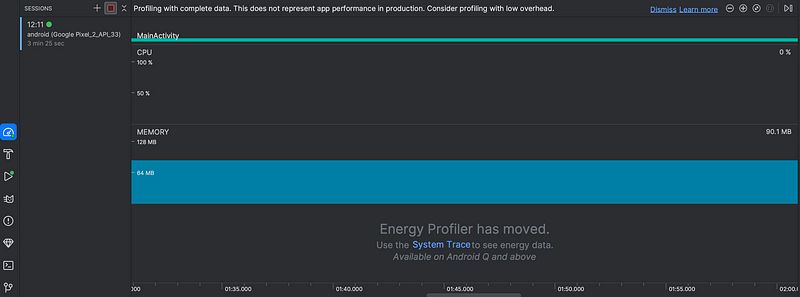
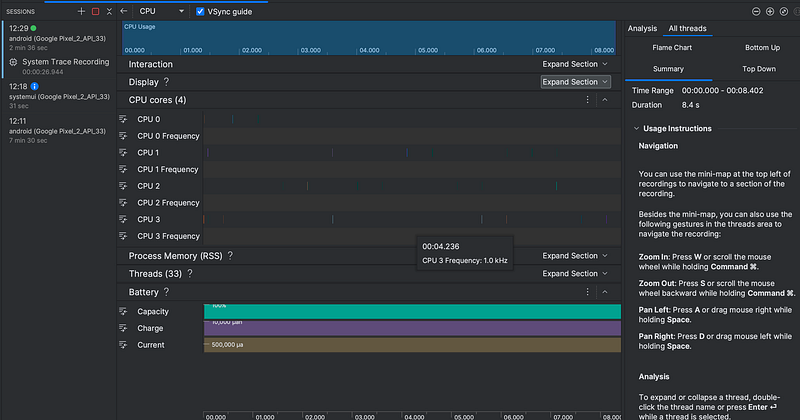
Starting in Android Studio Hedgehog, the Power Profiler shows power consumption on devices. You can view this new data in the On Device Power Rails Monitor (ODPM). It segments the information by subsystems called “Power Rails.” The System Trace records and displays power consumption data.
🔰Use the System Trace to see energy and power data.
🔰New Android App Links Assistant
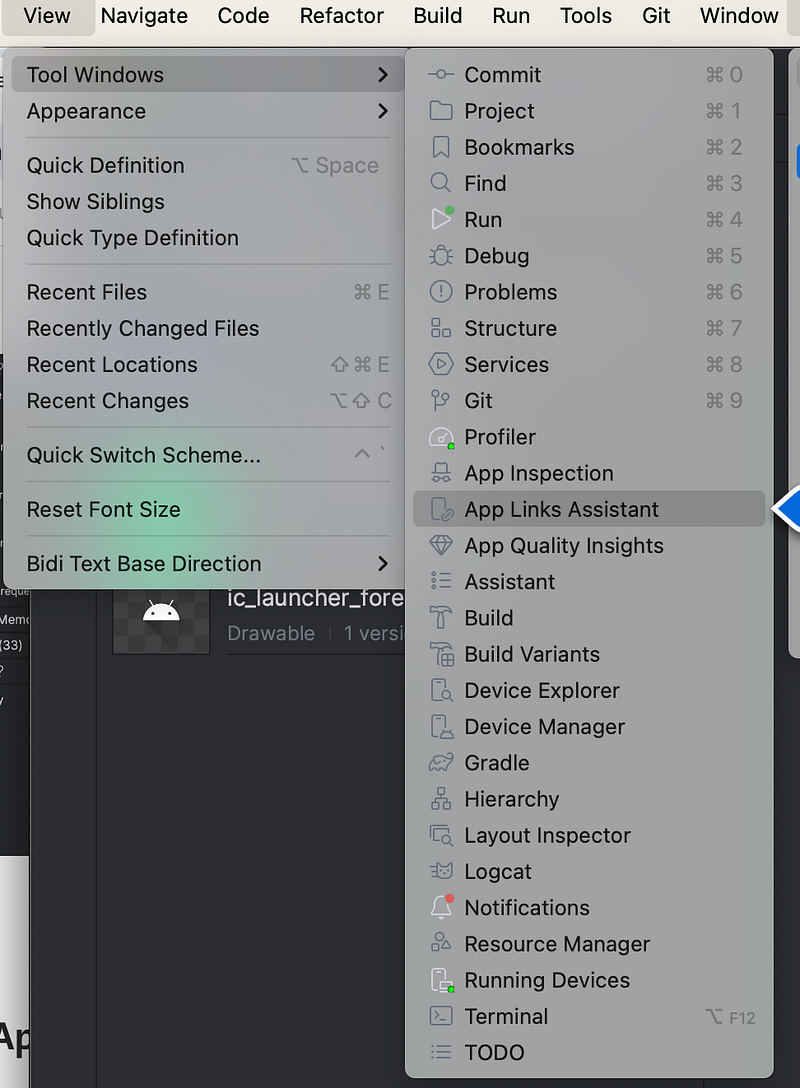
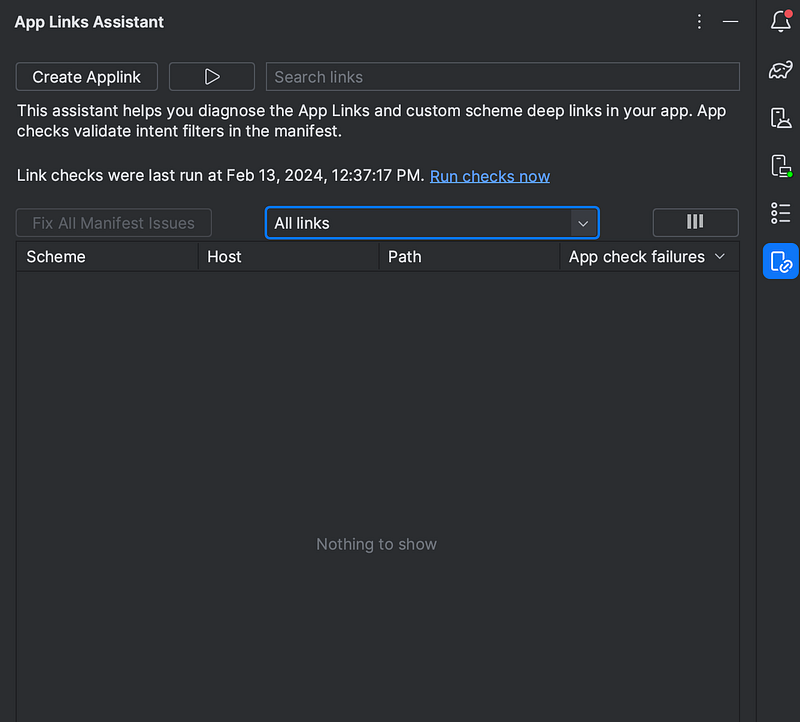
Android Studio HedgeHog introduces the new App Links Assistant that provides a comprehensive overview of the deep links setup in your app. The Assistant displays all existing deep links in the app’s Manifest.xml file, validates whether the configuration for those deep links is correct, and provides an easy and quick way to automatically fix the misconfigurations. Check out the link:
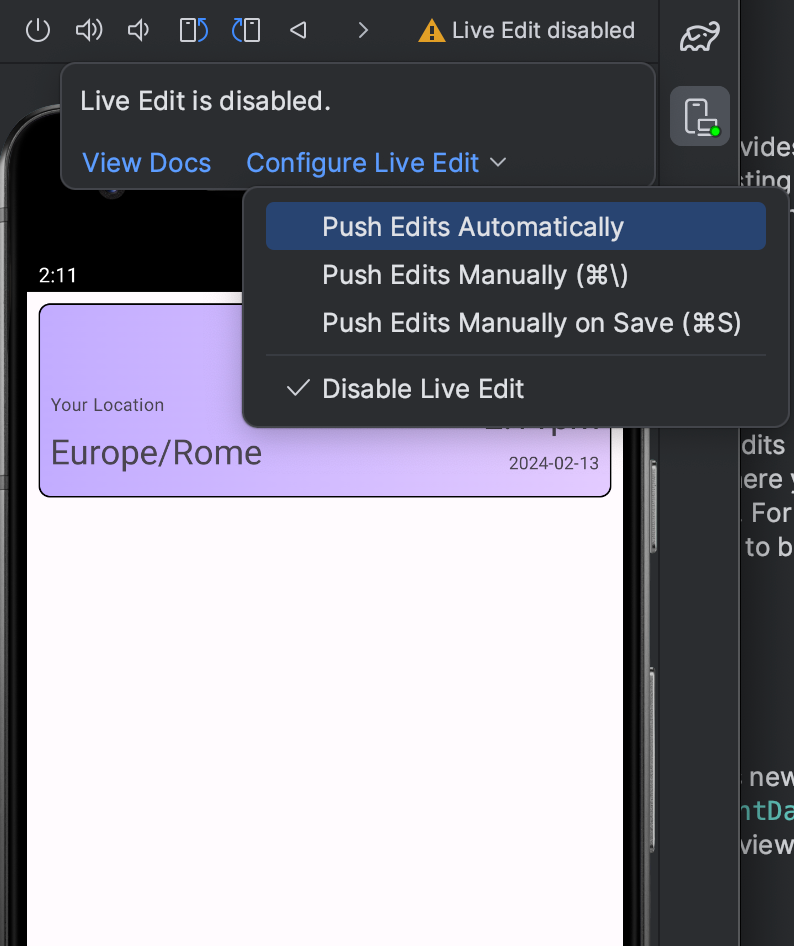
🔰Live Edit updated manual mode shortcut
(Push Manually): Control+\
Command+\ (for macOS)
Live Edit includes a new shortcut for pushing edits in manual mode (Push Edits Manually): Control+\\ (Command+\\ for macOS). Manual mode is helpful in situations where you want to have precise control over when updates are deployed to the running application. For example, if you’re making a large scale change in a file and don’t want any intermediate state to be reflected on the device.
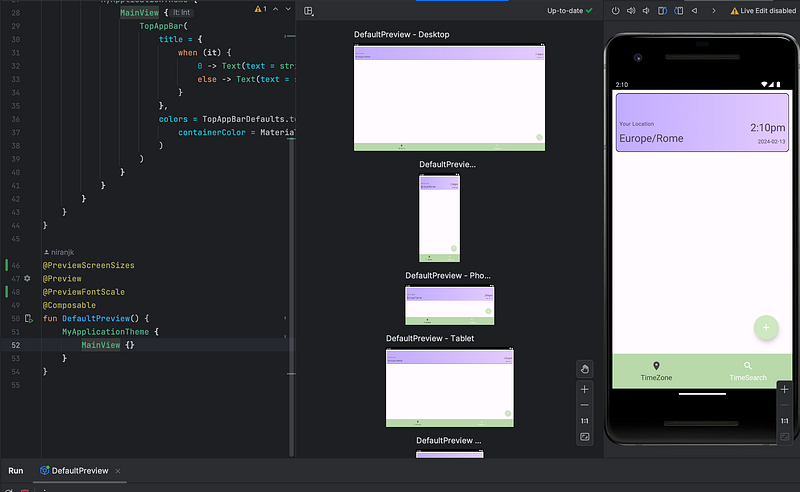
🔰Compose Multipreview templates
androidx.compose.ui:ui-tooling-preview 1.6.0-alpha01+ introduces new Multipreview API templates: @PreviewScreenSizes, @PreviewFontScales, @PreviewLightDark, and @PreviewDynamicColors, so that with one single annotation, you can preview your Compose UI in common scenarios.
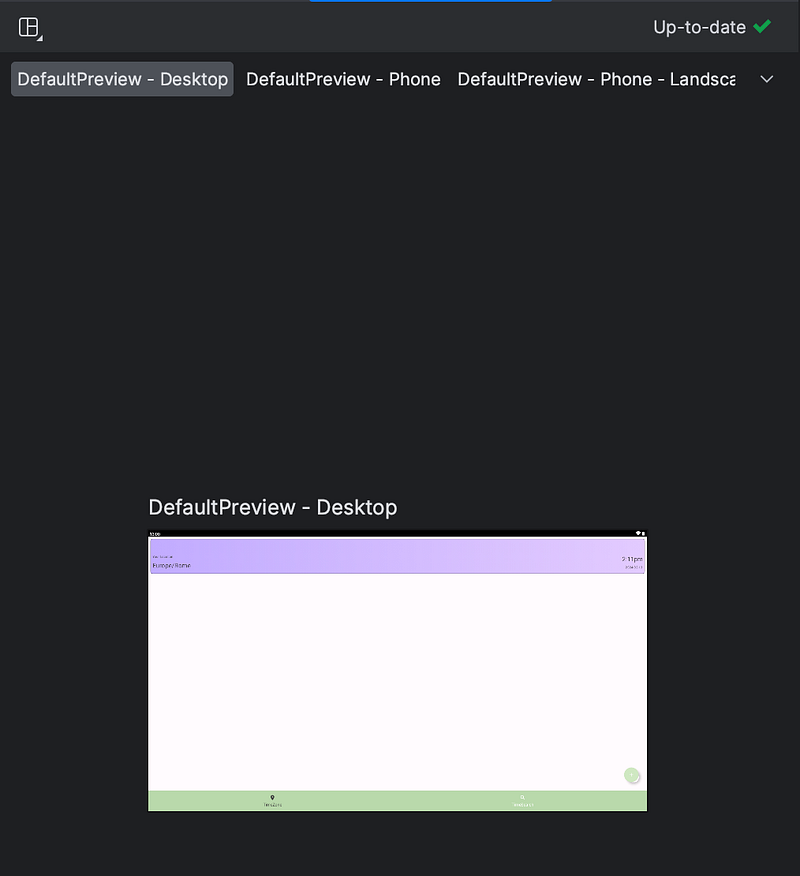
🔰Compose Preview Gallery mode
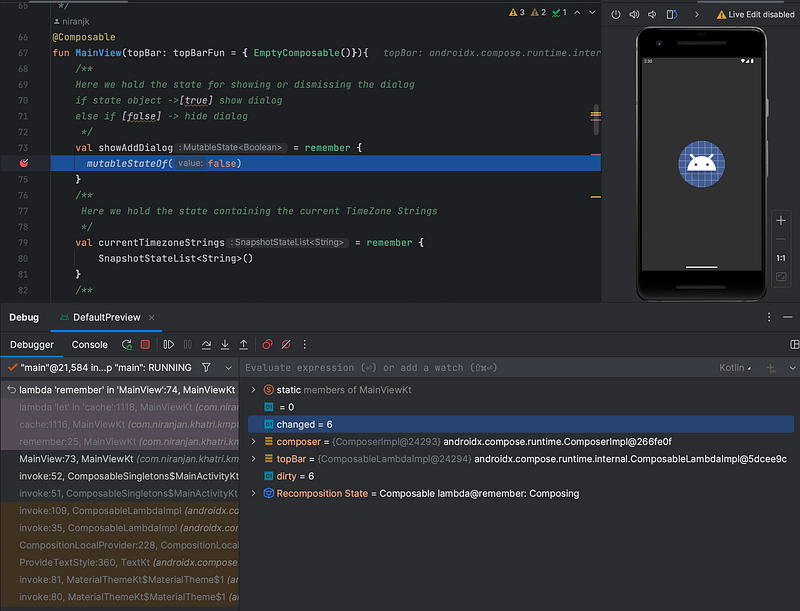
🔰Compose state information in debugger
When parts of your Compose UI recompose unexpectedly, it’s sometimes difficult to understand why. Now, when setting a breakpoint on a composable function, the debugger lists the parameters of the composable and their state, so you can more easily identify what changes might have caused the recomposition.
🔰Device mirroring
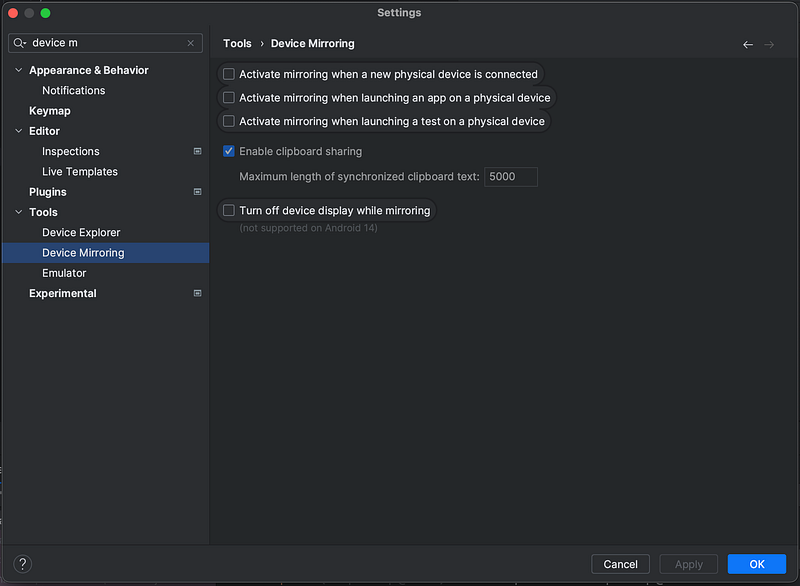
Mirror your physical device to execute common actions such as starting apps and interacting with them, rotating the screen, folding and unfolding the phone, changing the volume, and more — right from the Studio IDE. Device mirroring is always enabled. You can start and stop mirroring using the Running Devices window or the Device Manager.
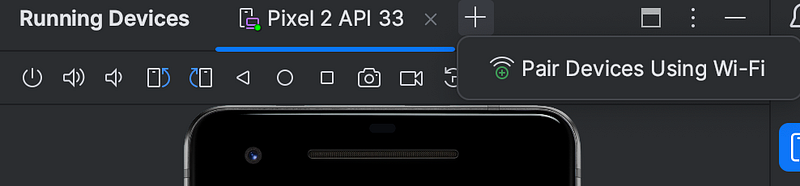
🔰Manage devices directly from the Running Devices window
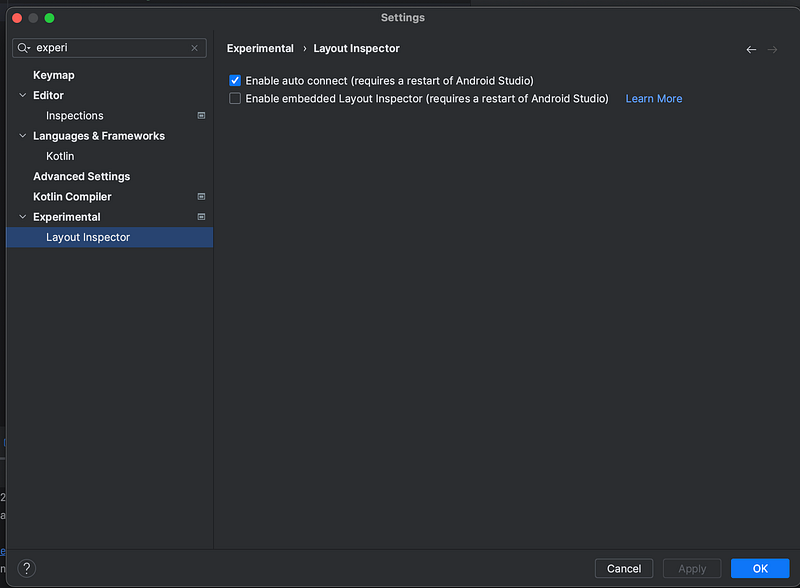
🔰Embedded Layout Inspector
Starting with Android Studio Hedgehog Canary 2, you can run the Layout Inspector directly in the Running Devices tool window. This experimental feature conserves screen real estate and helps organize your UI debugging workflow in a single tool window. In embedded mode you can show a view hierarchy, inspect the properties of each view, and access other common Layout Inspector features.