
Data Science
10 Pandas Functions That Help You Understand a Dataset Completely
Pandas is the best Python module for exploratory data analysis (EDA)

Many junior data scientists think a majority of problems they need to handle are from fancy deep learning models.
However, in reality, lots of problems are from the data.
Exploring and cleaning data sounds boring and not as cool as training state-of-art AI models. But if you want to be a professional data scientist, exploratory data analysis and data preprocessing are essential skills as well.
Fortunately, many awesome tools that can help you understand your datasets. Pandas, which is a famous Python data processing module, is one of them.
This article will introduce 10 super helpful functions of Pandas which are used frequently for exploratory data analysis purposes.
First of all, let’s import the Pandas module and make a DataFrame using the famous “Netflix Movies and TV Shows” dataset as our example data:
import pandas as pd
df = pd.read_csv('netflix_titles.csv')
1. head() or tail(): Check the Top or Last 5 Rows of a DataFrame
When you received a new dataset, nothing is as intuitive as looking at the data table directly.
However, sometimes the dataset is too large to be gone through row by row. It’s a good idea to get the first impression by checking the first or last 5 rows of the DataFrame. At the very least, it helps you understand the basic structure of the data.
In Pandas, the head() and tail() functions are used for this purpose:
df.head()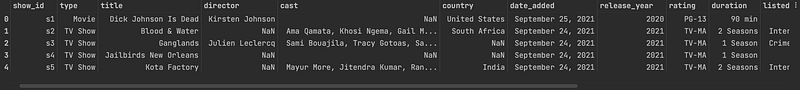
df.tail()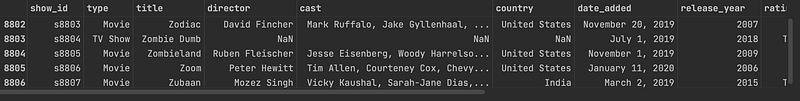
2. shape: Get To Know the Numbers of Rows and Columns
Since a Pandas DataFrame is a two dimension table. The “shape” of this table is significant information for us. We can get it directly through the shape property:
df.shapeAnd the outputs are:
(8807, 12)It told us that there are 8807 rows and 12 columns of this dataset.
3. columns: List all Names of Columns
The columns property can tell you all the names of columns of a DataFrame.
df.columnsThe outputs are:
Index(['show_id', 'type', 'title', 'director', 'cast', 'country', 'date_added','release_year', 'rating', 'duration', 'listed_in', 'description'],dtype='object')4. index: Get the Range of the Index
Similarly, you can get to know the range of a DataFrame’s index through the index property:
df.indexIt will print the following information:
RangeIndex(start=0, stop=8807, step=1)5. info(): Get more Details about the DataFrame
There is another function in Pandas that can provide you with more details about a DataFrame — info().
df.info()The results after executing the above function are as follows:
<class 'pandas.core.frame.DataFrame'>
RangeIndex: 8807 entries, 0 to 8806
Data columns (total 12 columns):
# Column Non-Null Count Dtype
--- ------ -------------- -----
0 show_id 8807 non-null object
1 type 8807 non-null object
2 title 8807 non-null object
3 director 6173 non-null object
4 cast 7982 non-null object
5 country 7976 non-null object
6 date_added 8797 non-null object
7 release_year 8807 non-null int64
8 rating 8803 non-null object
9 duration 8804 non-null object
10 listed_in 8807 non-null object
11 description 8807 non-null object
dtypes: int64(1), object(11)
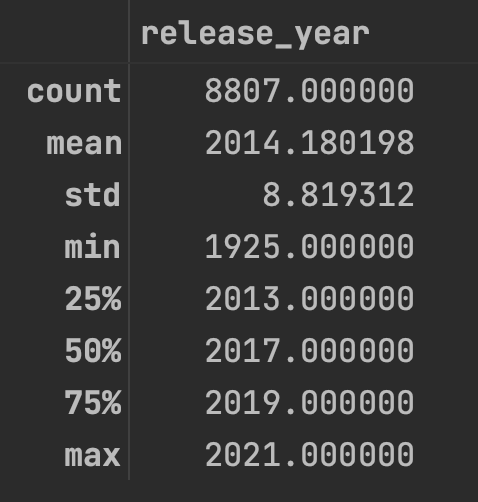
memory usage: 825.8+ KB6. describe(): Basic Statistical Analysis of Numerical Columns
If the data of one column is numerical, we can use the describe() function to get some basic but important statistical indicators, such as the mean/minimum/maximum value, standard deviation, and so on.
df.describe()The results of the above code are as follows:
7. isna(): Detect Missing Values of the DataFrame
Handling missing values is a headache. The good news is that Pandas has a function to help us detect missing values conveniently — isna().
df.isna()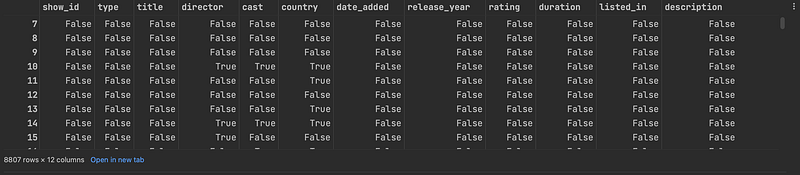
As shown above, the isna() function will return a DataFrame containing boolean values with the same size as the original DataFrame. All cells that are NA values, such as None or numpy.NaN will be True. And other cells will be False.
Sometimes, returning the same size large DataFrame is not a good idea. We can add the any() function after the isna() method to get to know whether a column contains NA values or not:
df.isna().any()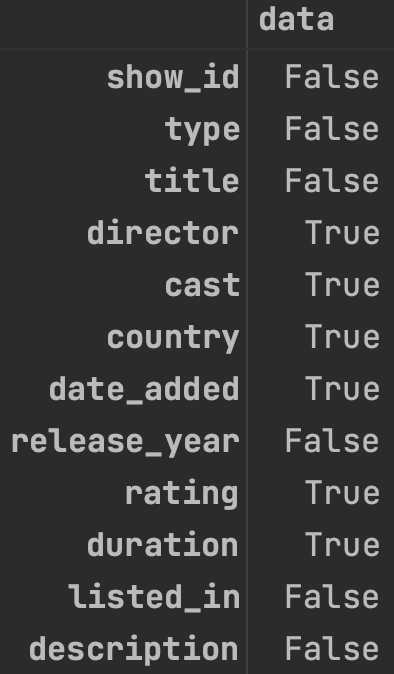
By the way, the isnull() function is an alias of the isna() function in Pandas. They work the same way.
Of course, the notna() function is the reversed one. It is to detect existing (non-missing) values.
8. unique(): Get all Unique Values of a Column
For a categorical column, it’s good to know all the distinct values of it. The unique() function can give you the expected results.
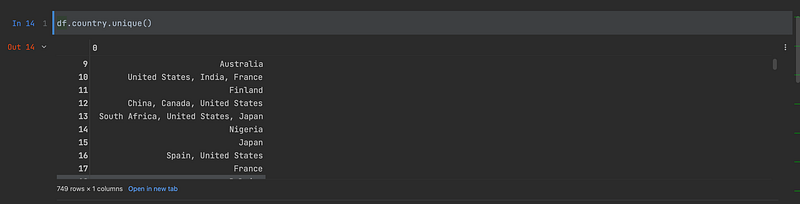
For example, we would like to know all the unique country names of the country column:
df.country.unique()The results are:
9. value_counts(): Get the Counts of Unique Values in the DataFrame
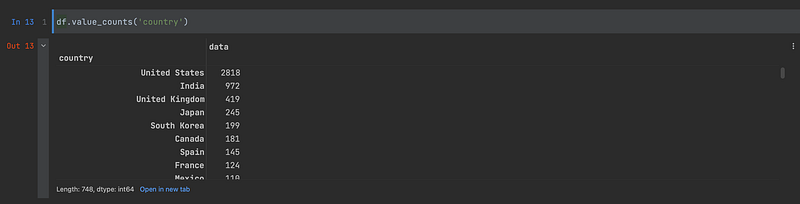
Furthermore, if we would like to know the counts of each distinct value of a categorical column, we can use the value_counts() method:
df.value_counts('country')Again, let’s execute the above code:
10. query(): Explore the DataFrame as You Like
For more complex data exploration tasks, the query() function is the ultimate tool. With the help of it, you can query Pandas DataFrames as conveniently as using SQL to query database tables.
For example, let’s execute a simple query:
df.query('release_year>=2021')
You can even add multiple conditions:
df.query('release_year>=2021 & type=="Movie"')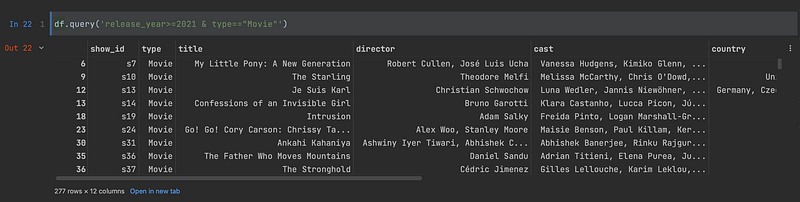
Thanks for reading. ❤️
Join Medium through my referral link to access millions of great articles:


