

10 Python Tools for Automated Exploratory Data Analysis
10 Best Python EDA Tools: Transform Data Analysis Fast!
Discover the top automated Python packages to streamline your exploratory data analysis and save time.
Exploratory Data Analysis (EDA) is crucial for developing data science models and studying datasets.
When encountering a new dataset, a significant amount of time is spent on EDA to uncover inherent information.
Automated EDA Python packages can execute EDA with a few lines of code.
1. D-Tale
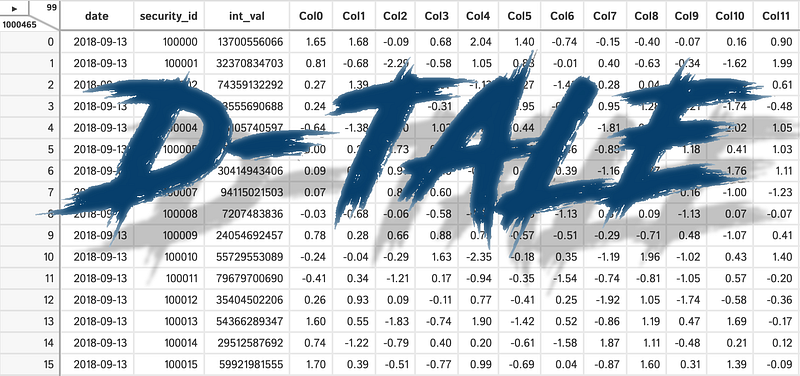
D-Tale uses Flask for the backend, React for the frontend, and integrates seamlessly with IPython notebooks and terminals.
D-Tale supports Pandas DataFrame, Series, MultiIndex, DatetimeIndex, and RangeIndex.
import dtale
import pandas as pd
dtale.show(pd.read_csv("titanic.csv"))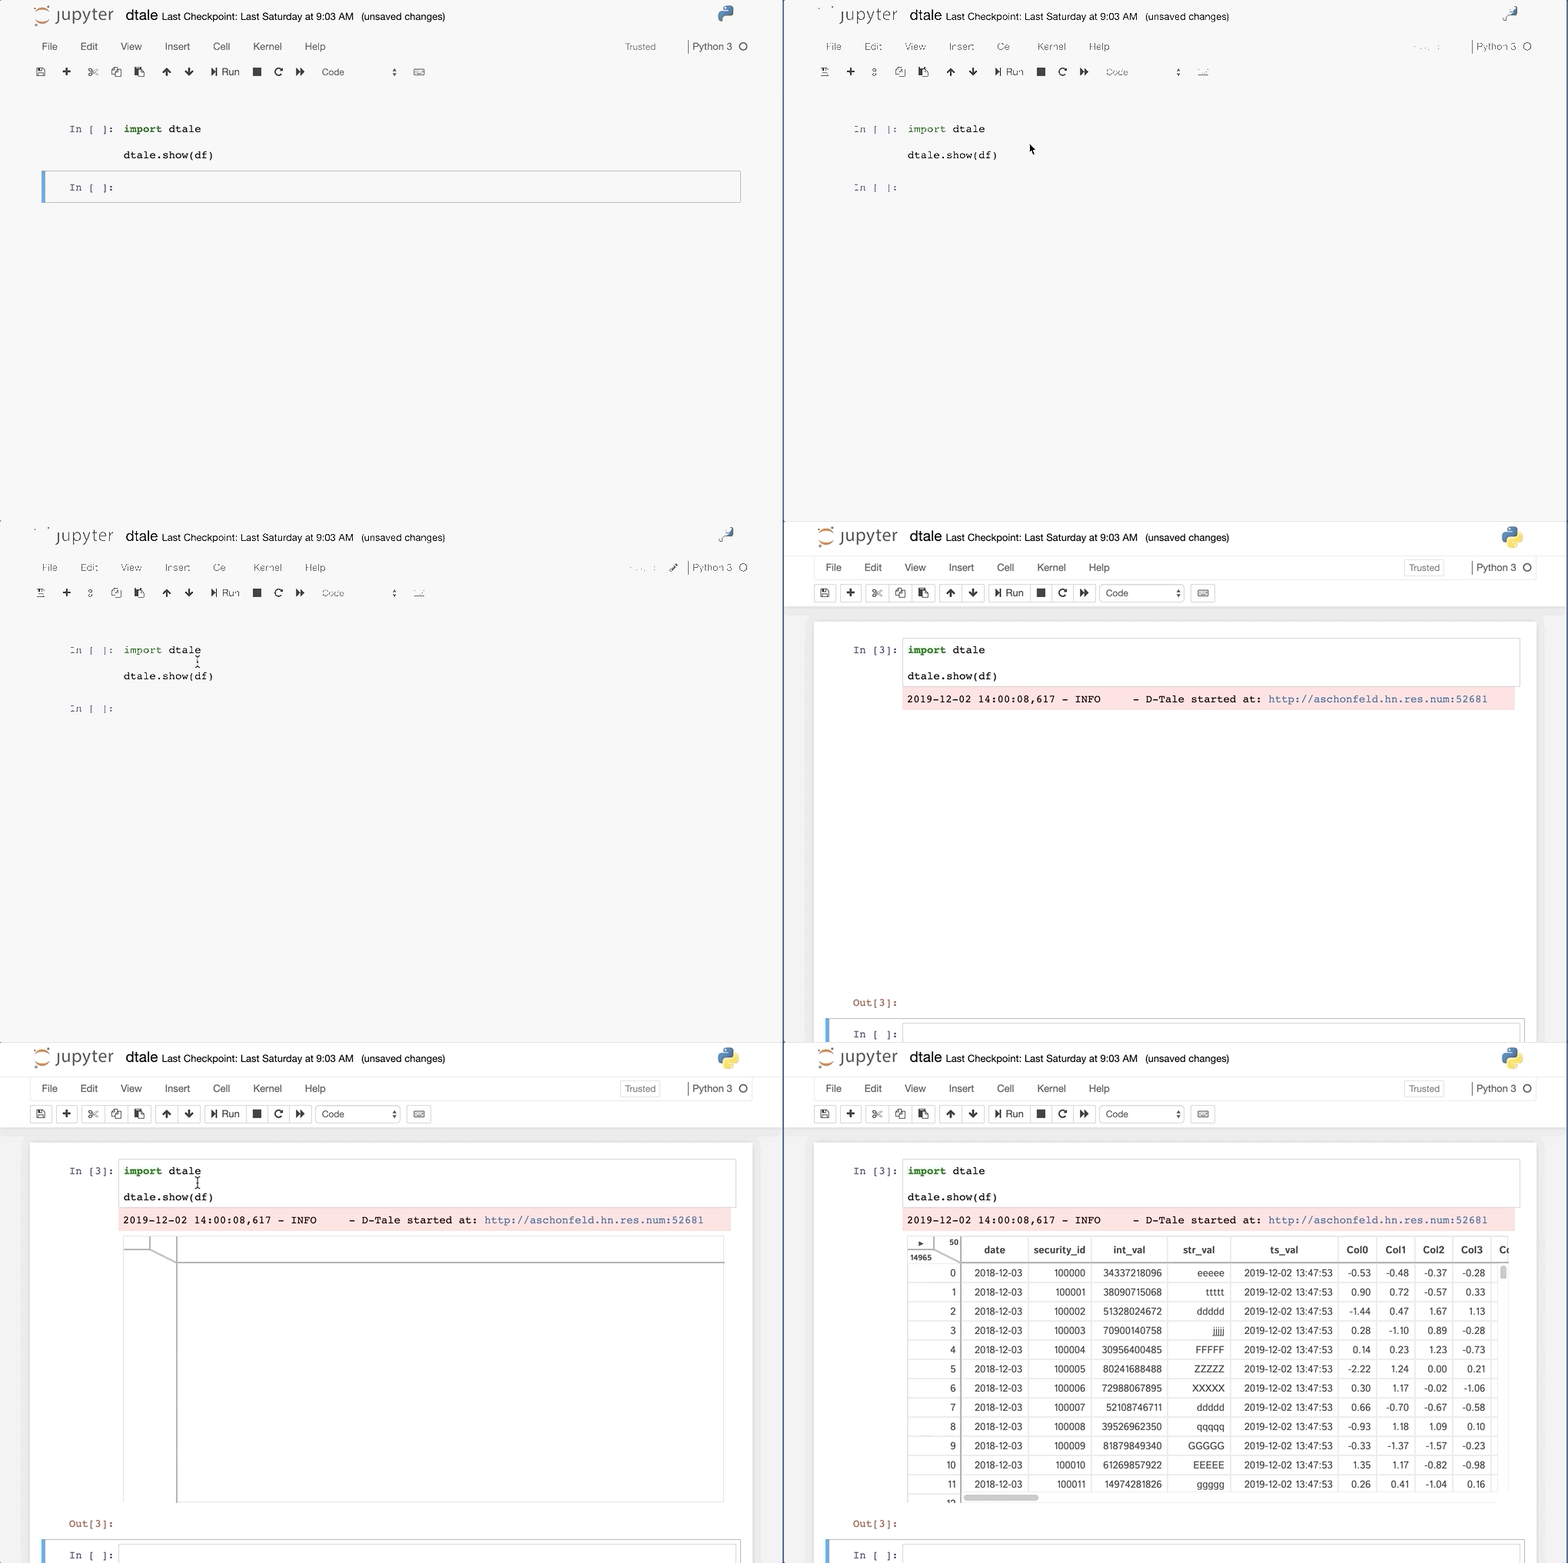
With just one line of code, D-Tale generates a report summarizing the dataset, correlations, charts, and heatmaps, and highlights missing values. It also provides interactive analysis for each chart in the report.
2. ydata-profiling
ydata-profiling generates summary reports for Pandas DataFrame.
It extends Pandas DataFrame with `df.profile_report()`, working efficiently on large datasets to create reports in seconds.
#Install the below libaries before importing
import pandas as pd
from ydata_profiling import ProfileReport

#EDA using pandas-profiling
profile = ProfileReport(pd.read_csv('titanic.csv'), explorative=True)

#Saving results to a HTML file
profile.to_file("output.html")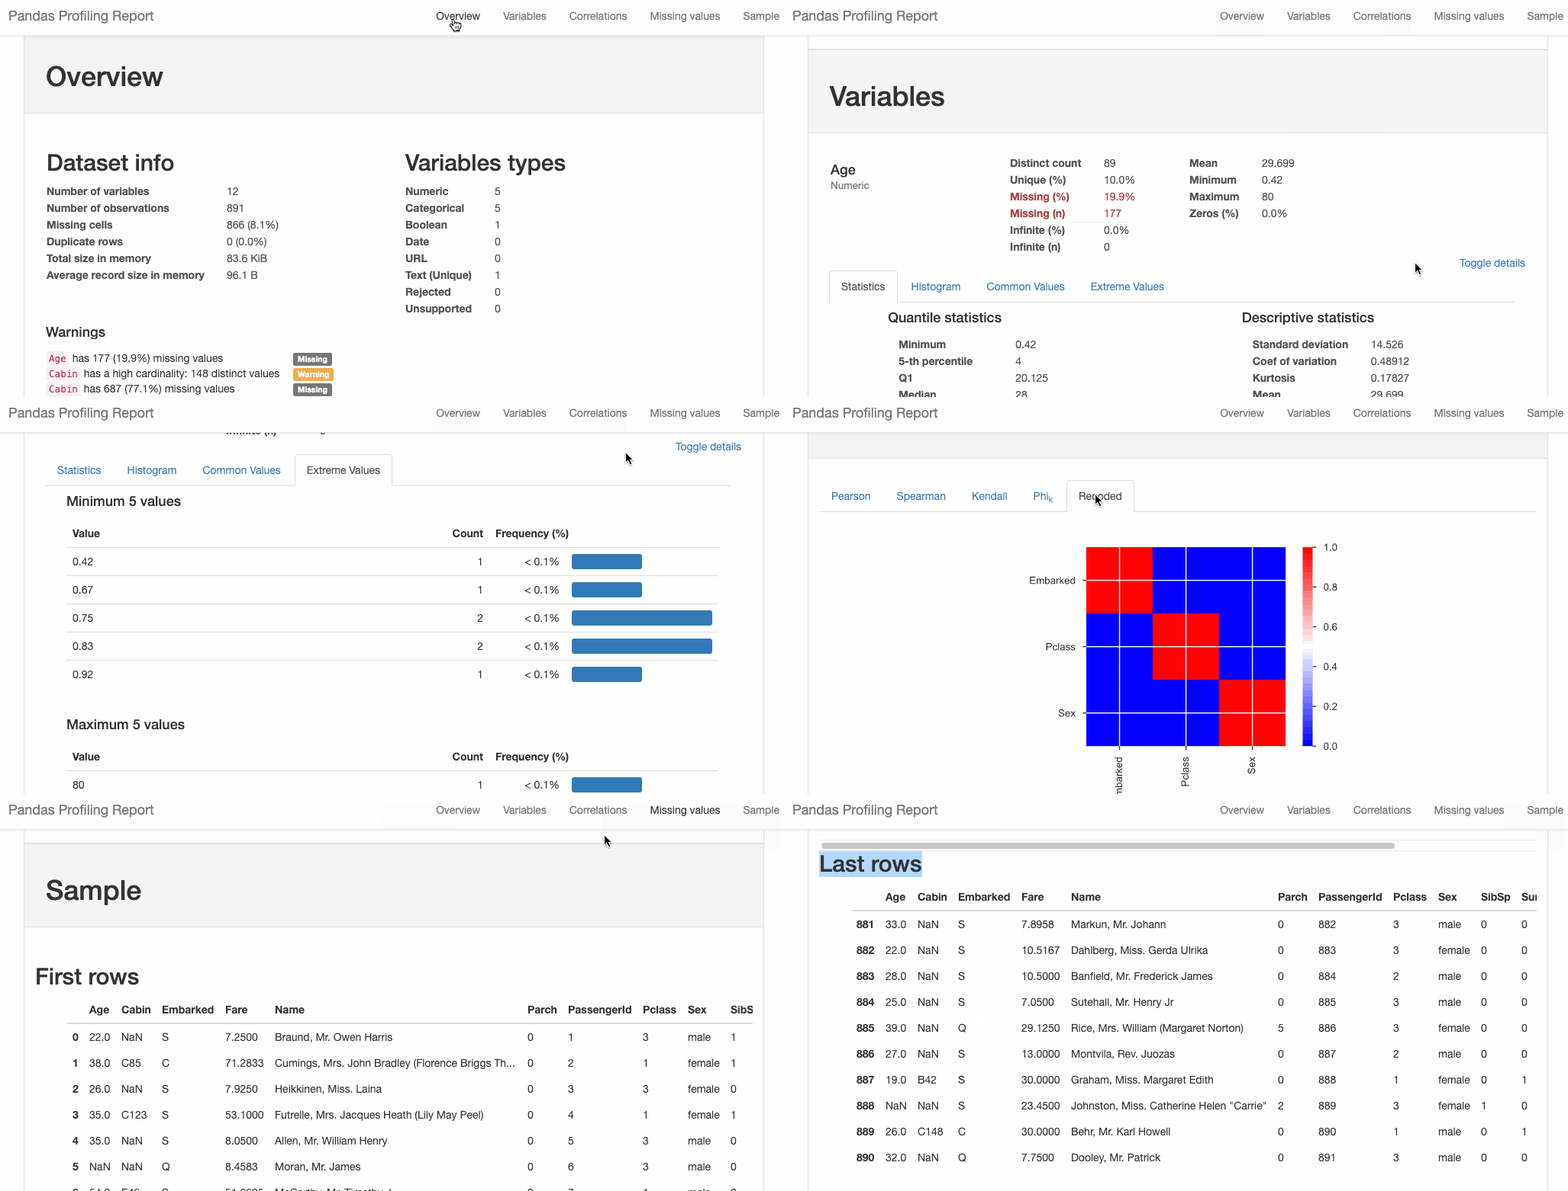
3. Sweetviz

Sweetviz is an open-source Python library that generates beautiful visualizations with just two lines of code, launching EDA as an HTML application.
It is built for quick visualization of target values and comparing datasets.
import pandas as pd
import sweetviz as sv

#EDA using Autoviz
sweet_report = sv.analyze(pd.read_csv("titanic.csv"))

#Saving results to HTML file
sweet_report.show_html('sweet_report.html')
Sweetviz reports summarize datasets, correlations, and the association of categorical and numerical features.

4. AutoViz
AutoViz automatically visualizes any size dataset with one line of code, generating reports in HTML, Bokeh, etc.
Users can interact with HTML reports generated by AutoViz.
import pandas as pd
from autoviz.AutoViz_Class import AutoViz_Class

#EDA using Autoviz
autoviz = AutoViz_Class().AutoViz('train.csv')
5. Dataprep
Dataprep is an open-source Python package for analyzing, preparing, and processing data.
Built on Pandas and Dask DataFrame, Dataprep integrates easily with other Python libraries.
Dataprep is the fastest among these packages, generating reports for Pandas/Dask DataFrame in seconds.
from dataprep.datasets import load_dataset
from dataprep.eda import create_report

df = load_dataset("titanic.csv")
create_report(df).show_browser()
6. Klib
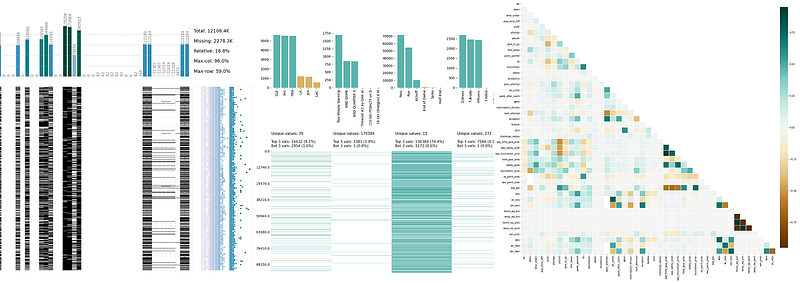
Klib is a Python library for importing, cleaning, analyzing, and preprocessing data.
import klib
import pandas as pd

df = pd.read_csv('DATASET.csv')
klib.missingval_plot(df)
While Klib offers many analysis functions, each requires manual coding, making it semi-automated. However, it is very convenient for custom analyses.
klib.missingval_plot(df) # default representation of missing values in a DataFrame, plenty of settings are available
klib.corr_plot(df, split='pos') # displaying only positive correlations, other settings include threshold, cmap...
klib.corr_plot(df, split='neg') # displaying only negative correlations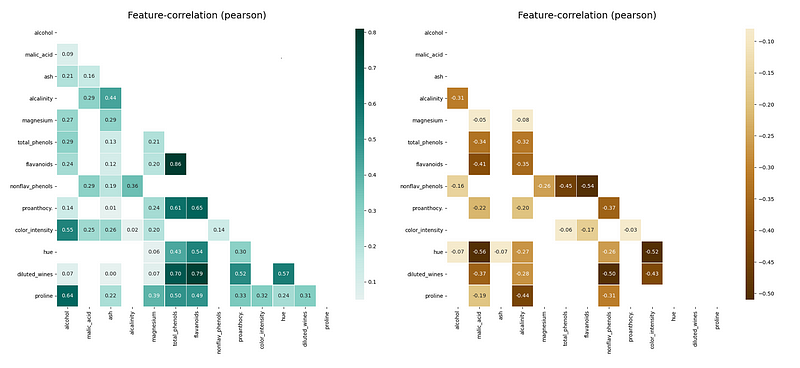
klib.corr_plot(df, target='wine') # default representation of correlations with the feature column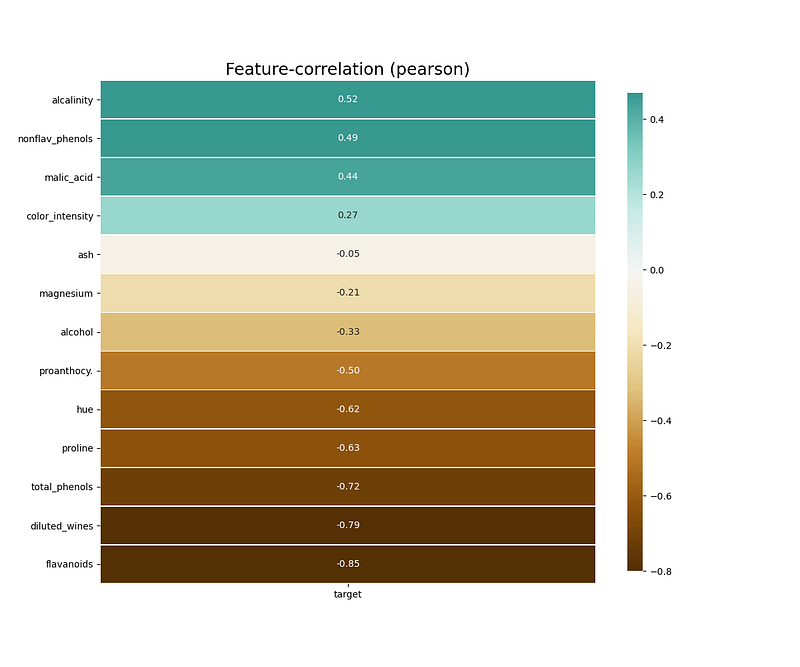
7. Dabl
Dabl focuses on providing quick overviews through visualization and convenient machine learning preprocessing and model search rather than individual column statistics.
The `plot()` function in Dabl visualizes various plots, including:
- Target distribution plots
- Scatter plots
- Linear discriminant analysis
import pandas as pd
import dabl

df = pd.read_csv("titanic.csv")
dabl.plot(df, target_col="Survived")
8. SpeedML
SpeedML is a Python package for quickly launching machine learning pipelines.
It integrates common ML packages such as Pandas, Numpy, Sklearn, Xgboost, and Matplotlib, offering more than just automated EDA.
According to its creators, SpeedML reduces coding time by 70% through iterative development.
from speedml import Speedml

sml = Speedml('../input/train.csv', '../input/test.csv',
            target = 'Survived', uid = 'PassengerId')
sml.train.head()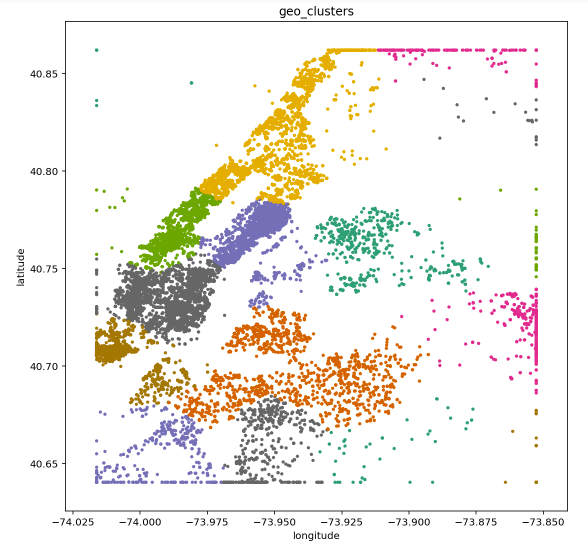
9. DataTile
DataTile (formerly Pandas-Summary) is an open-source Python package for managing, summarizing, and visualizing data.
It extends the Pandas DataFrame `describe()` function.
import pandas as pd
from datatile.summary.df import DataFrameSummary

df = pd.read_csv('titanic.csv')
dfs = DataFrameSummary(df)
dfs.summary()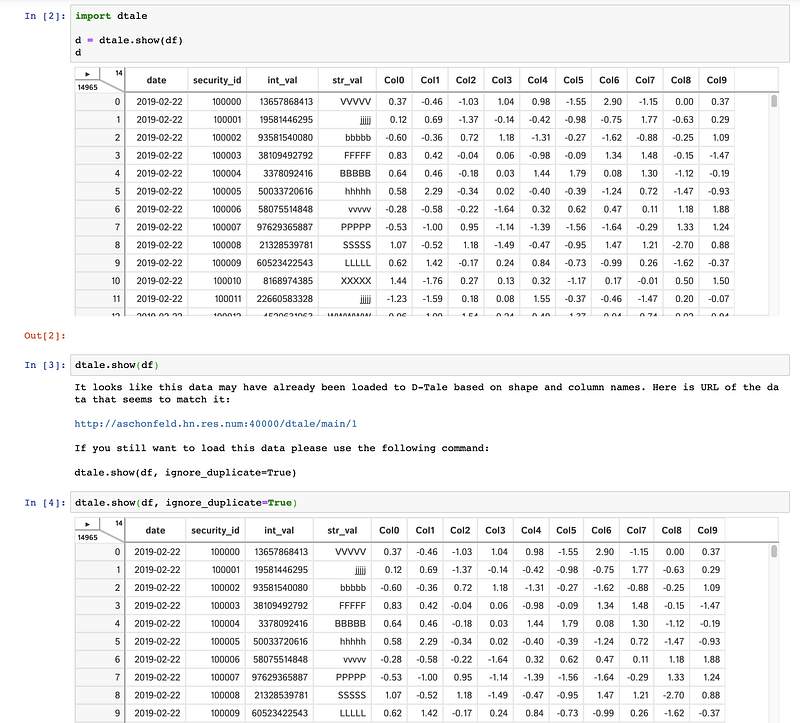
10. edaviz
Edaviz is a Python library for data exploration and visualization in Jupyter Notebook and Jupyter Lab. It was highly useful but has since been integrated into Bamboolib after being acquired by Databricks.

Conclusion
In this article, we introduced 10 automated EDA Python packages that generate data summaries and visualizations with a few lines of code. These tools save significant time through automation.
Dataprep is my most-used EDA package, with AutoViz and D-Tale being other excellent choices. Klib is convenient for custom analysis, while SpeedML’s comprehensive integration is less suited for EDA alone. Other packages can be chosen based on personal preference, though edaviz is no longer open-source.
Connect with us on Substack to stay in the loop with the latest AI stories. Let’s shape the future of AI together!
Connect with us on Substack to stay updated with Python stories. Let’s learn Python together!


